Empowering Airlines to Optimize Ad Campaigns and Boost Passenger Engagement
Empowering Airlines to Optimize Ad Campaigns and Boost Passenger Engagement
Empowering Airlines to Optimize Ad Campaigns and Boost Passenger Engagement


Introduction
Introduction
To comply with non-disclosure agreement, I have omitted and obfuscated confidential information in this case study. All information in this case study is my own and does not necessarily reflect the views & facts of the company.
To comply with non-disclosure agreement, I have omitted and obfuscated confidential information in this case study. All information in this case study is my own and does not necessarily reflect the views & facts of the company.
Challenge
Challenge
Maximizing airlines' ancillary revenue through seamless ad campaign management, while enhancing passenger engagement with minimal friction. Our goal is to create an experience that integrates transactional and engagement aspects of in-flight advertising, ensuring high-value ad placements and optimal passenger interaction.
Maximizing airlines' ancillary revenue through seamless ad campaign management, while enhancing passenger engagement with minimal friction. Our goal is to create an experience that integrates transactional and engagement aspects of in-flight advertising, ensuring high-value ad placements and optimal passenger interaction.
Results
Results
To address this challenge, we developed a comprehensive ad management platform that empowers airlines to seamlessly manage and optimize their ad campaigns. The solution includes features for detailed targeting, media uploads, and in-depth analytics on desktop. Airlines can create tailored campaigns, upload various media types, and analyze performance with minimal friction.
To address this challenge, we developed a comprehensive ad management platform that empowers airlines to seamlessly manage and optimize their ad campaigns. The solution includes features for detailed targeting, media uploads, and in-depth analytics on desktop. Airlines can create tailored campaigns, upload various media types, and analyze performance with minimal friction.
Duration
Duration
3 months (2024)
3 months (2024)
My Role
My Role
UX Designer
UX Designer
Contribution
Contribution
Problem definition; POC flows; user testing and synthesis; high-fidelity prototypes; MVP documentation and QA
Problem definition; POC flows; user testing and synthesis; high-fidelity prototypes; MVP documentation and QA
Team
Team
Product Owner; Snr Software Engineers
Product Owner; Snr Software Engineers
Company
Company
Lufthansa (AERQ)
Lufthansa (AERQ)
Problem Definition
Problem Definition
How might we design an intuitive and data-driven platform that enhances the ad management process for airlines, leading to more effective and impactful inflight ad campaigns?
How might we design an intuitive and data-driven platform that enhances the ad management process for airlines, leading to more effective and impactful inflight ad campaigns?
Analysis
Analysis
Stakeholder interviews
Stakeholder interviews
5 participants
5 participants
Benchmarking
Benchmarking
3 competitors
3 competitors
Key Assumptions
Key Assumptions
Streamlined Dashboard
Streamlined Dashboard
IFE managers need a simple dashboard for efficient campaign management.
IFE managers need a simple dashboard for efficient campaign management.
Targeted Ad Tools
Targeted Ad Tools
Advertisers require better targeting tools for increased engagement.
Advertisers require better targeting tools for increased engagement.
Real-Time Analytics
Real-Time Analytics
The product must provide real-time insights to adjust strategies swiftly.
The product must provide real-time insights to adjust strategies swiftly.
Problems
Problems
Lack of Targeting Precision
Ad management tools struggle with targeting accuracy, leading to inconsistent performance and lower ROI for airlines.
Lack of Targeting Precision
Ad management tools struggle with targeting accuracy, leading to inconsistent performance and lower ROI for airlines.
Fragmented Tool Ecosystem
The current tools are fragmented, causing inefficiencies in managing ad campaigns across multiple platforms.
Fragmented Tool Ecosystem
The current tools are fragmented, causing inefficiencies in managing ad campaigns across multiple platforms.
Weak Analytics Capabilities
Insufficient analytics features prevent actionable insights, hindering real-time, data-driven decision-making.
Weak Analytics Capabilities
Insufficient analytics features prevent actionable insights, hindering real-time, data-driven decision-making.
How might we create a unified and intuitive ad management platform that enhances ad targeting, streamlines campaign management, and delivers real-time insights tailored to the needs of IFE managers and advertising partners in the airline industry?
How might we create a unified and intuitive ad management platform that enhances ad targeting, streamlines campaign management, and delivers real-time insights tailored to the needs of IFE managers and advertising partners in the airline industry?
Who are our users?
Who are our users?
Based on 1:1 interviews with 6 professionals from different airlines, we identified two key user groups for our ad management platform: Inflight Entertainment (IFE) Managers and Advertising Partners. These groups have distinct goals and challenges, seeking a platform that integrates intuitive navigation with data-driven insights to better meet their respective needs.
Based on 1:1 interviews with 6 professionals from different airlines, we identified two key user groups for our ad management platform: Inflight Entertainment (IFE) Managers and Advertising Partners. These groups have distinct goals and challenges, seeking a platform that integrates intuitive navigation with data-driven insights to better meet their respective needs.
User research findings
User research findings
1:1 Interviews
1:1 Interviews
6 participants
6 participants
Through in-depth interviews, 2 primary user personas emerged:
Through in-depth interviews, 2 primary user personas emerged:
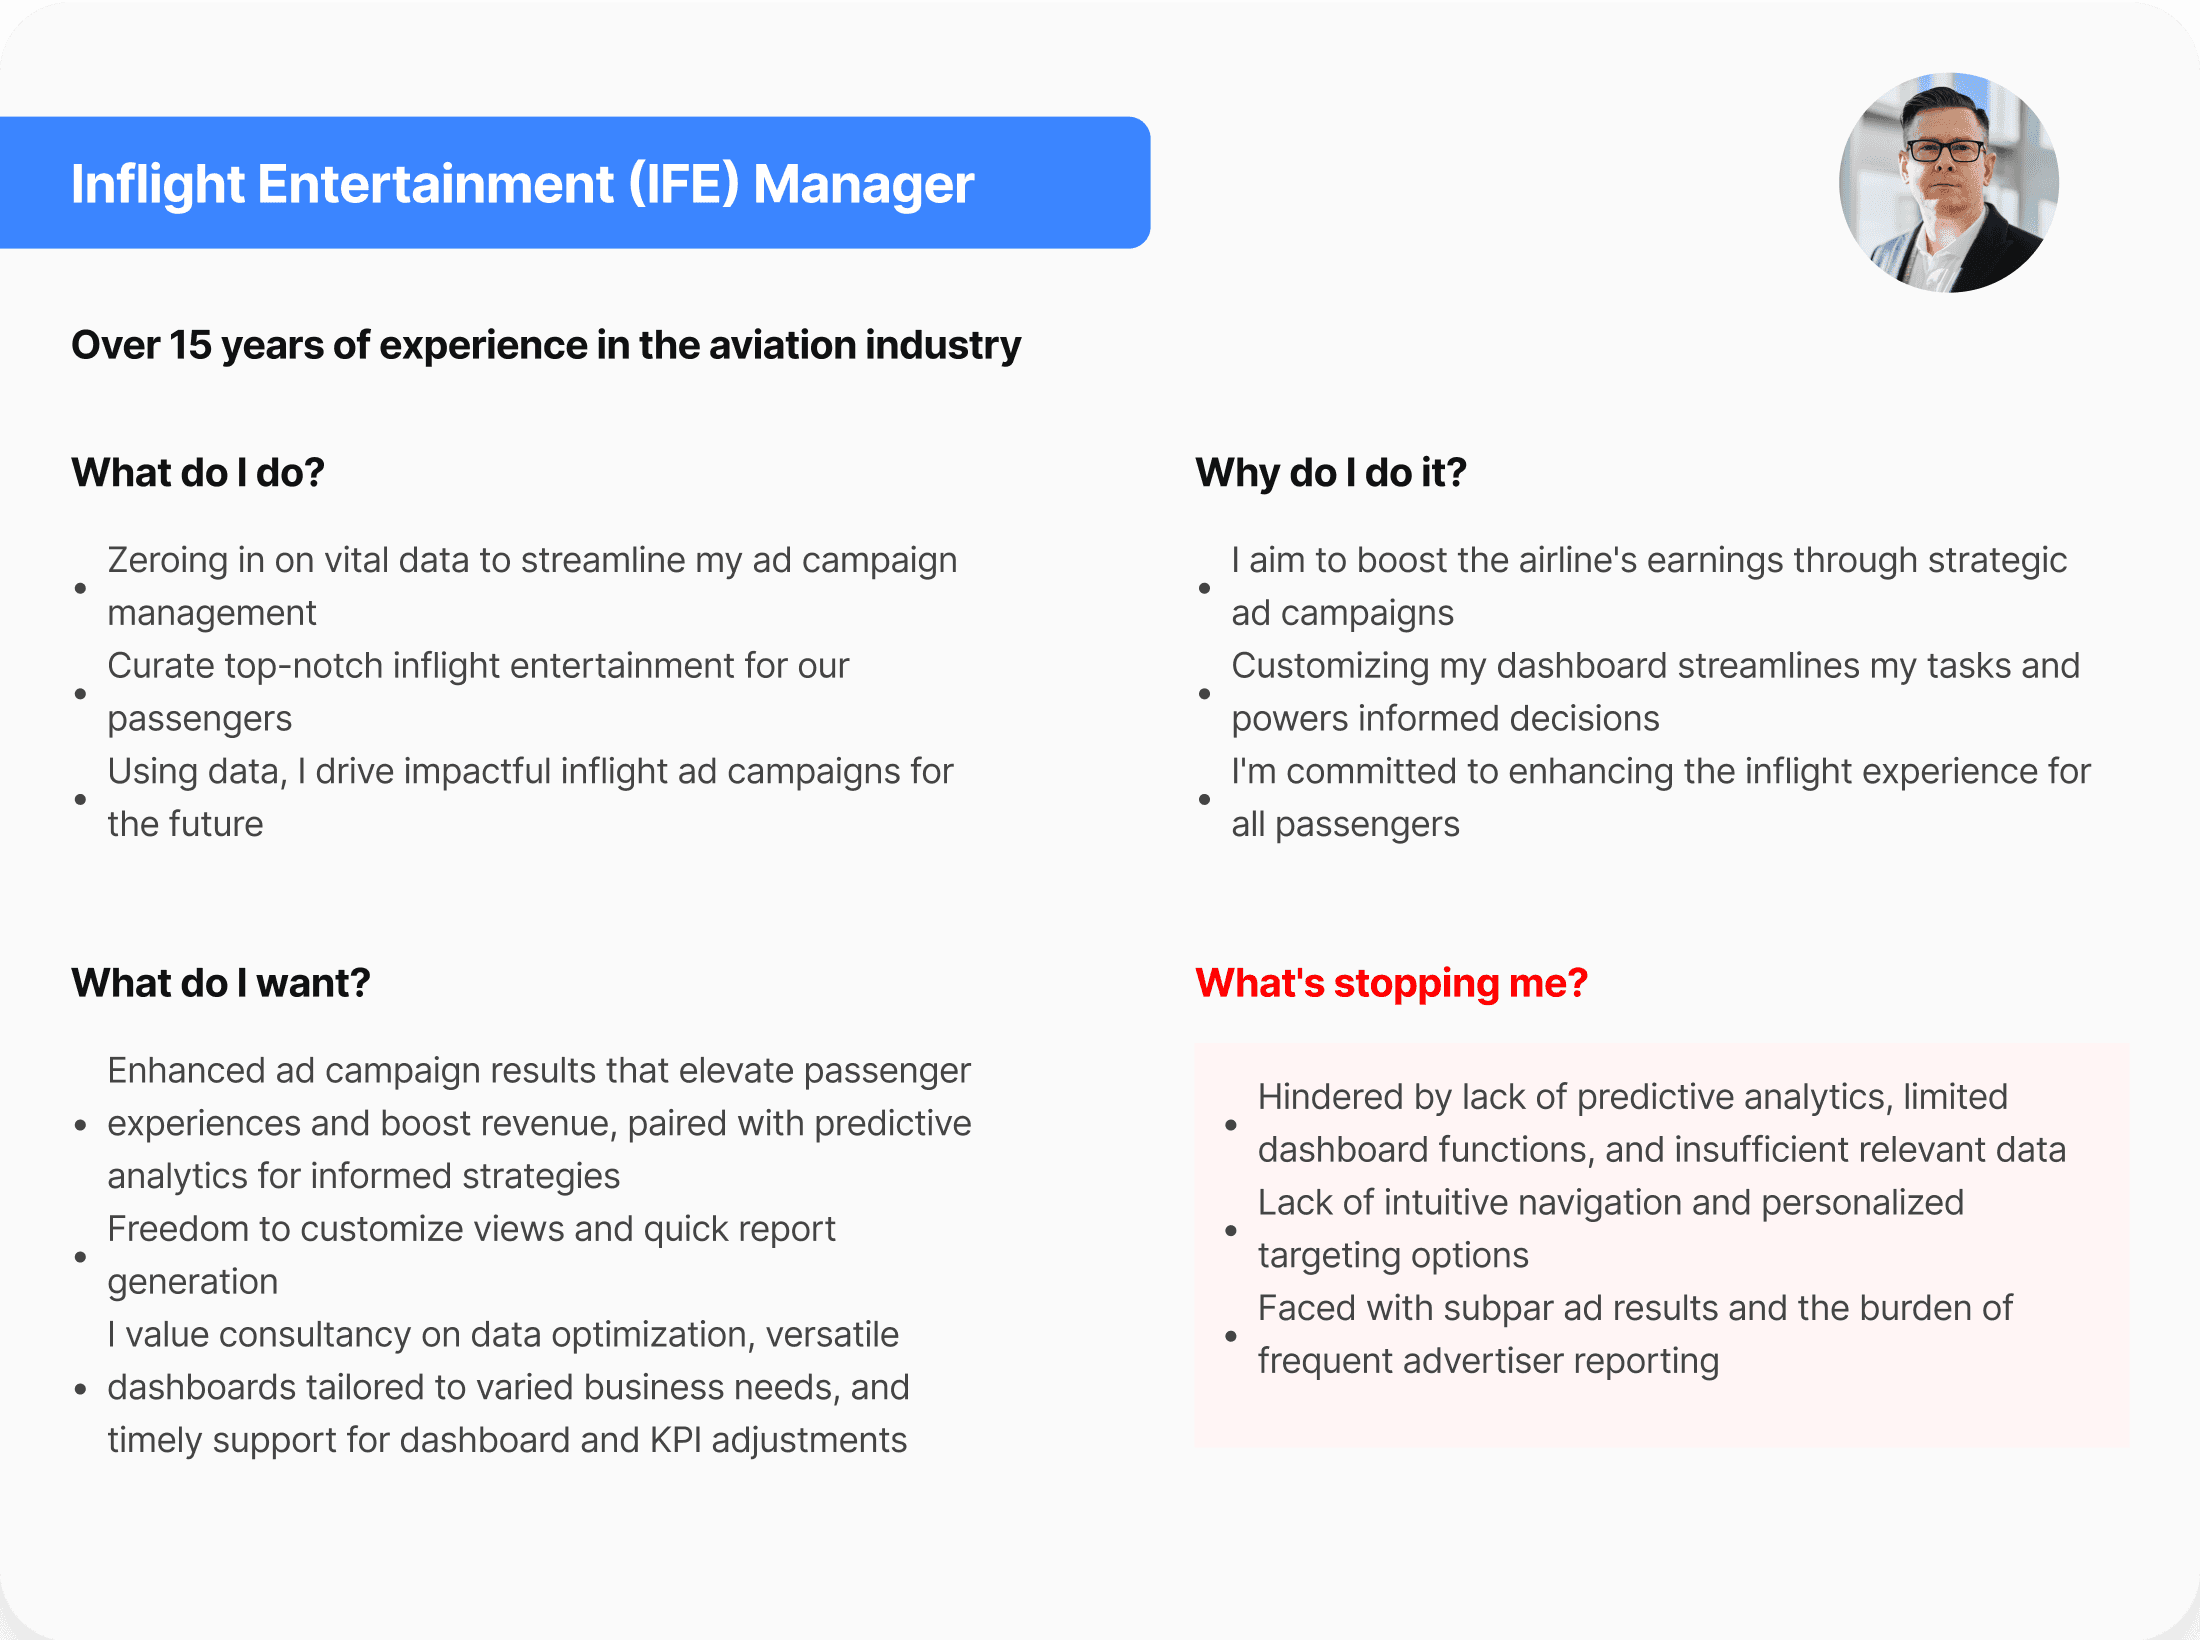

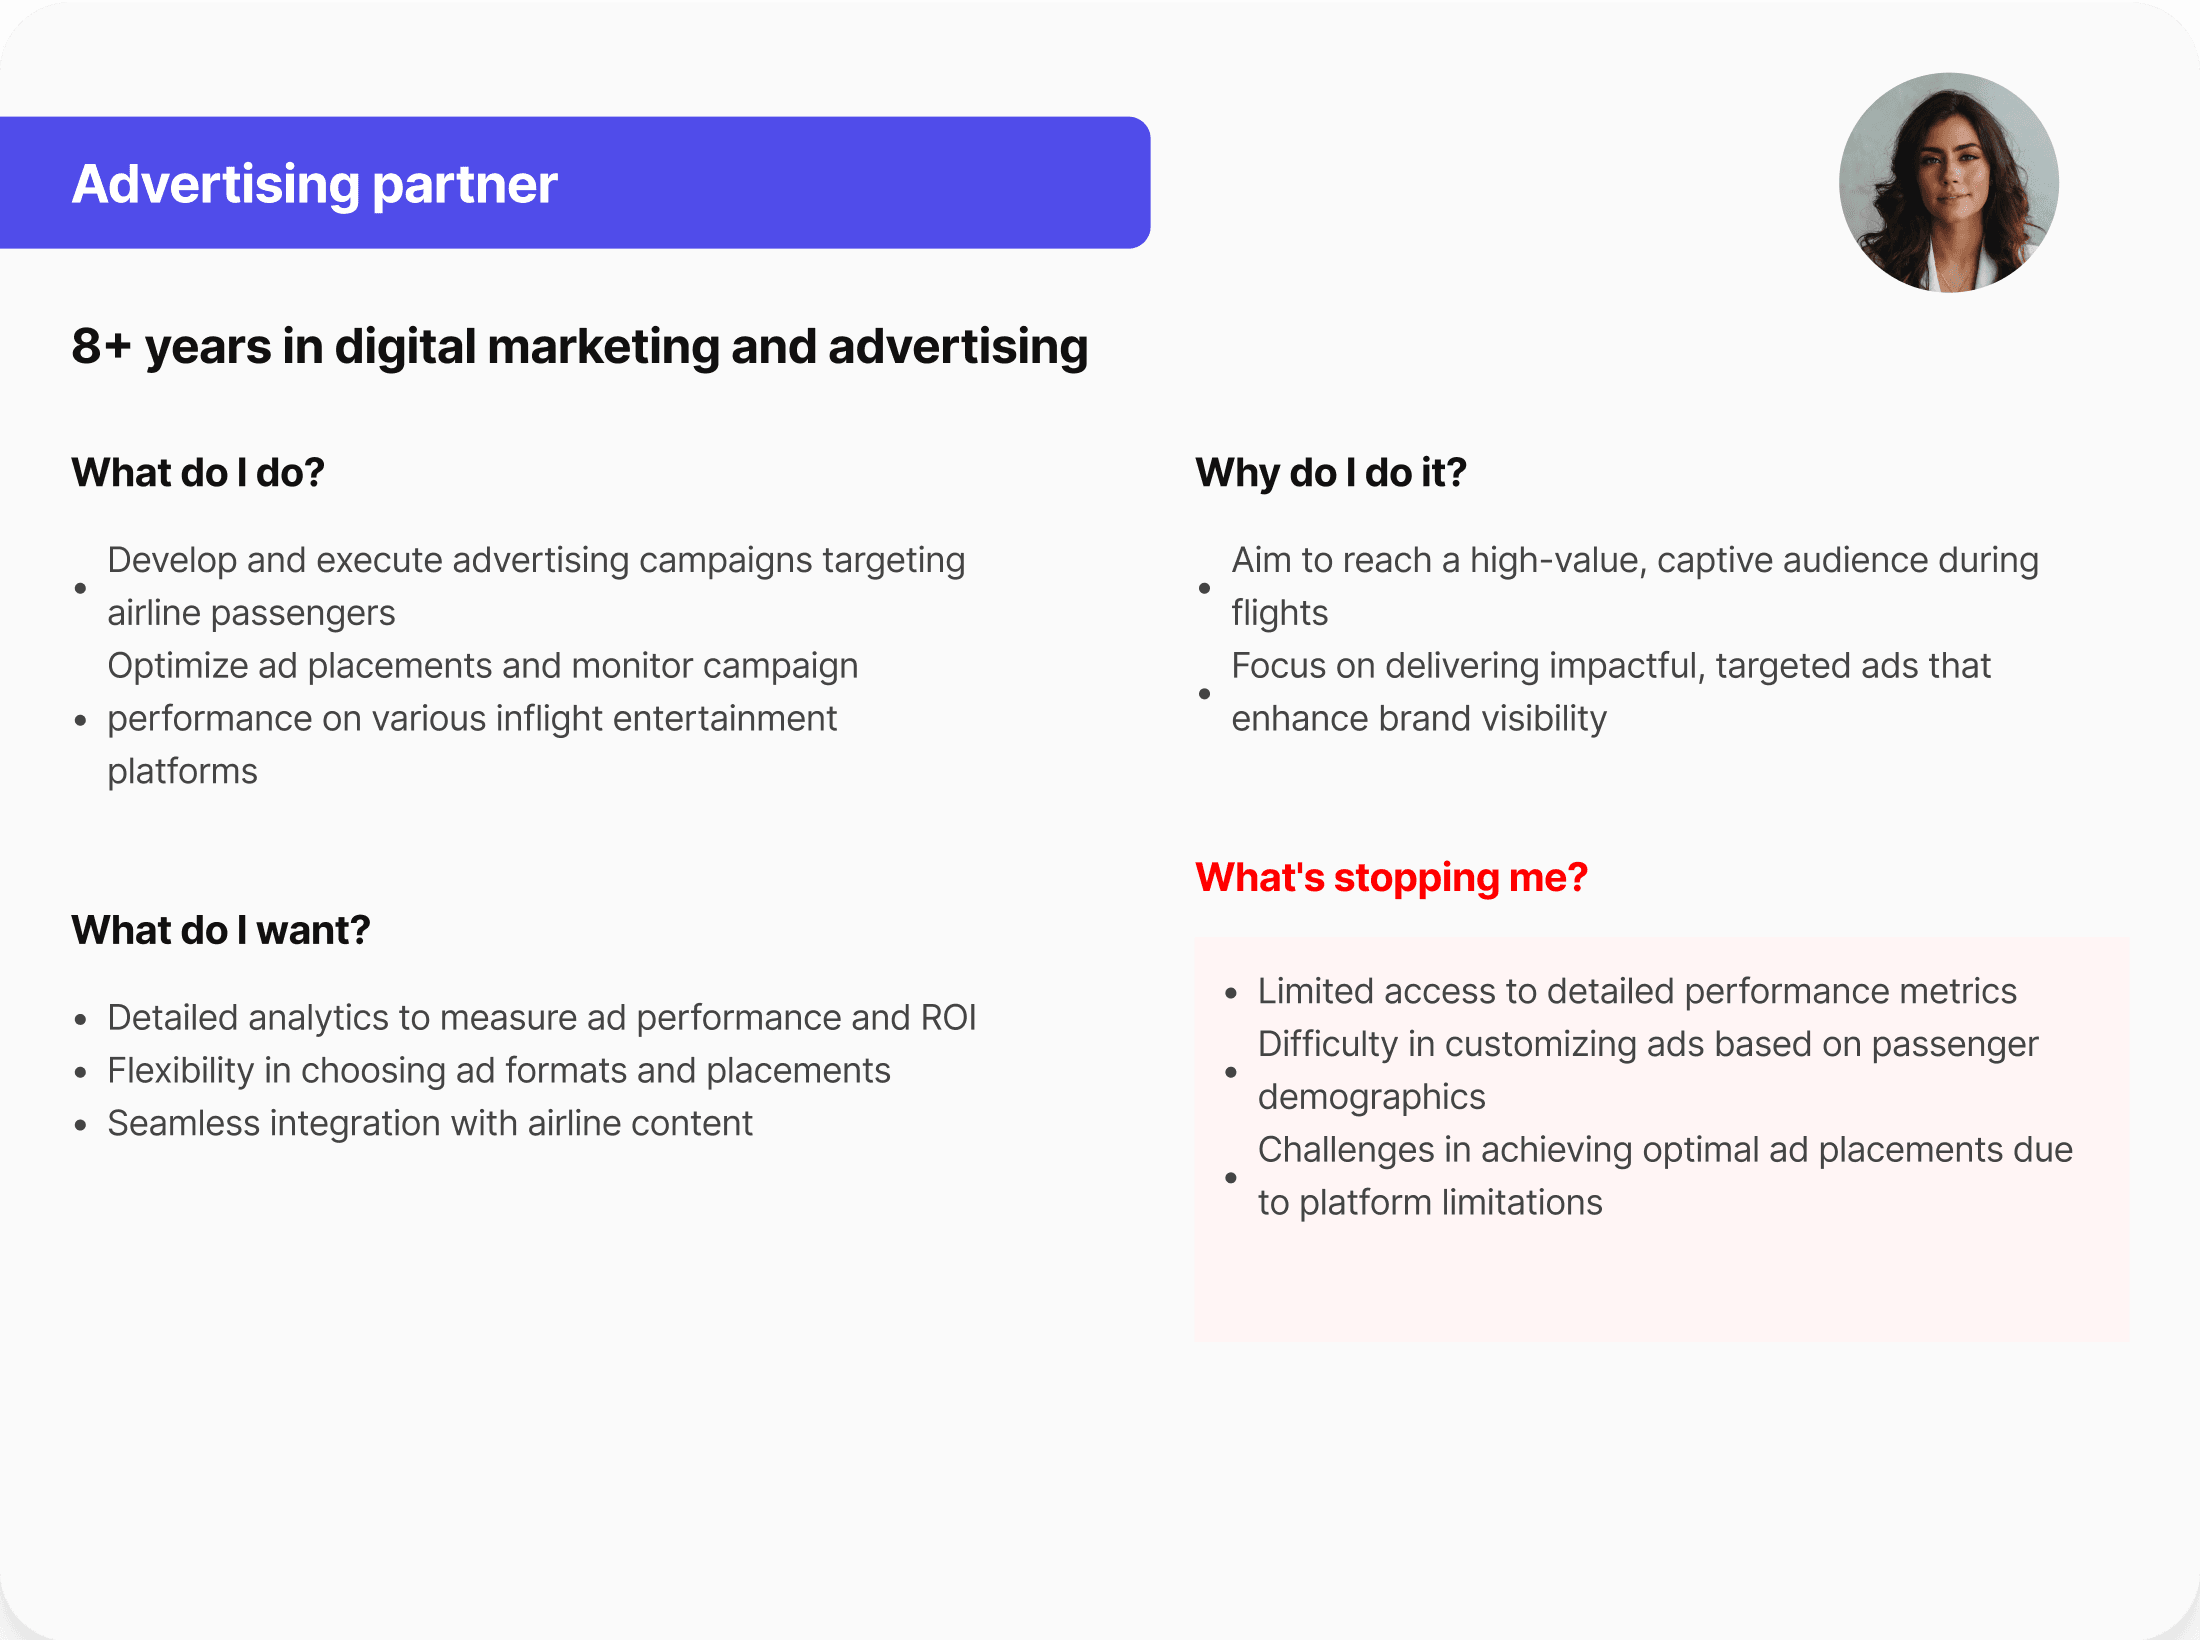

Personas developed based on 6 interviews
Personas developed based on 6 interviews
Understand Users’ Intentions
Understand Users’ Intentions
Research outcome
Research outcome
Real-Time Feedback
Real-Time Feedback
Users need instant access to campaign metrics for quick adjustments.
Users need instant access to campaign metrics for quick adjustments.
Customization
Customization
Users prefer flexibility in dashboard designs and metrics selection.
Users prefer flexibility in dashboard designs and metrics selection.
Detailed Metrics
Detailed Metrics
In-depth performance analysis is crucial for better decision-making.
In-depth performance analysis is crucial for better decision-making.
Simplified Campaign Creation
Simplified Campaign Creation
Reducing the time and effort to launch campaigns is vital.
Reducing the time and effort to launch campaigns is vital.
Comprehensive Analysis
Comprehensive Analysis
Users seek detailed reports for future strategies.
Users seek detailed reports for future strategies.
I categorized the users’ feedback, their expectations and intentions into 5 categories: real-time performance feedback, customizable dashboards, detailed performance metrics, streamlined campaign creation, and in-depth campaign analysis. To better understand users’ intentions I utilized the rainbow sheet analysis method.
I categorized the users’ feedback, their expectations and intentions into 5 categories: real-time performance feedback, customizable dashboards, detailed performance metrics, streamlined campaign creation, and in-depth campaign analysis. To better understand users’ intentions I utilized the rainbow sheet analysis method.
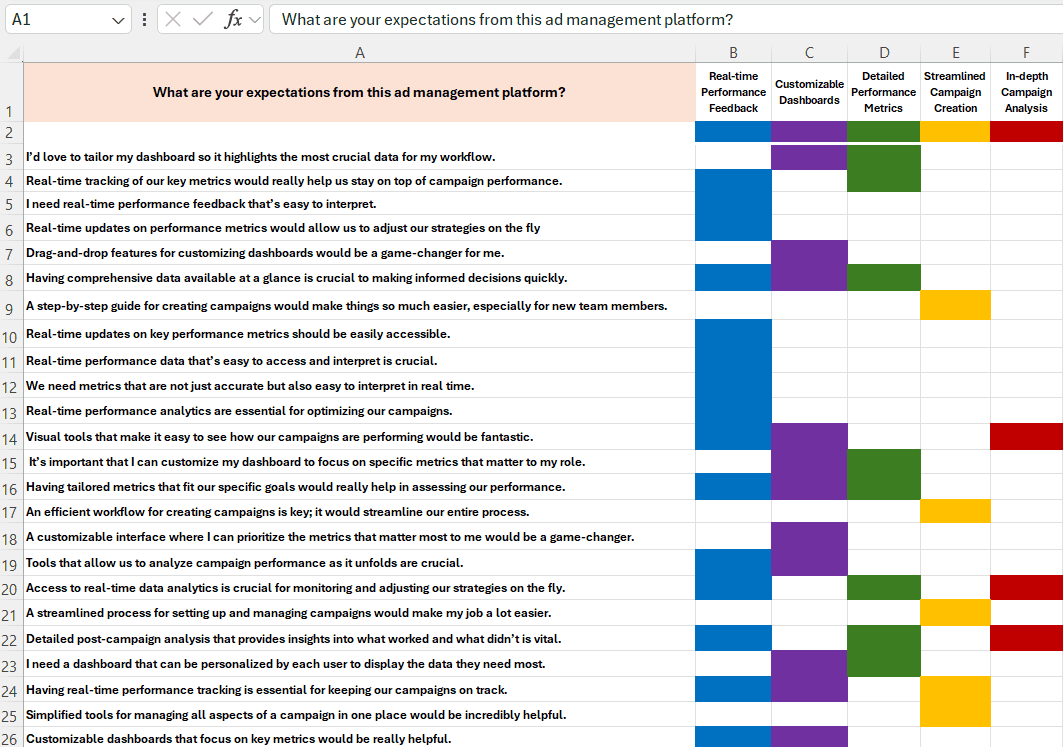

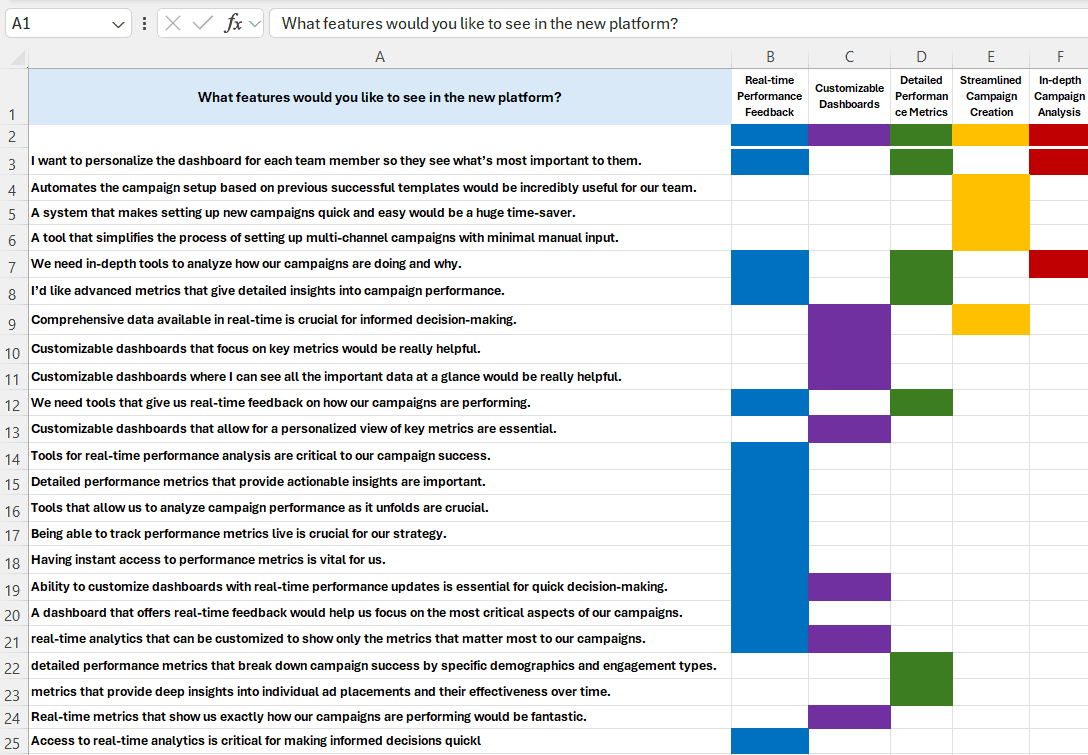

Rainbow sheet created by me
Rainbow sheet created by me
Design Goals
Design Goals
We established the primary design goals based on the insights gathered from stakeholder interviews, workshops, and the analysis of user needs. The overarching objective is to design an intuitive, data-driven, and user-friendly ad management platform tailored for the airline industry.
We established the primary design goals based on the insights gathered from stakeholder interviews, workshops, and the analysis of user needs. The overarching objective is to design an intuitive, data-driven, and user-friendly ad management platform tailored for the airline industry.
Real-time Performance Feedback
Real-time Performance Feedback
Enable instant access to campaign performance metrics.
Provide actionable insights that allow for immediate optimization of campaigns.
Design intuitive interfaces that present real-time data clearly and concisely.
Enable instant access to campaign performance metrics.
Provide actionable insights that allow for immediate optimization of campaigns.
Design intuitive interfaces that present real-time data clearly and concisely.
Customizable Dashboards
Customizable Dashboards
Offer flexible dashboard layouts that can be tailored to individual needs.
Allow users to choose which metrics and data points are most relevant to them.
Include quick access features for frequently used tools and reports.
Offer flexible dashboard layouts that can be tailored to individual needs.
Allow users to choose which metrics and data points are most relevant to them.
Include quick access features for frequently used tools and reports.
Detailed Performance Metrics
Detailed Performance Metrics
Provide comprehensive analytics to measure ad performance across multiple dimensions.
Include features that allow for the deep dive into specific data points.
Ensure metrics are presented in a way that supports strategic decision-making.
Provide comprehensive analytics to measure ad performance across multiple dimensions.
Include features that allow for the deep dive into specific data points.
Ensure metrics are presented in a way that supports strategic decision-making.
Streamlined Campaign Creation
Streamlined Campaign Creation
Simplify the process of creating and managing ad campaigns with templates and guided workflows.
Integrate tools that assist in setting up, running, and monitoring campaigns efficiently.
Ensure the platform reduces the time and effort required to launch a campaign.
Simplify the process of creating and managing ad campaigns with templates and guided workflows.
Integrate tools that assist in setting up, running, and monitoring campaigns efficiently.
Ensure the platform reduces the time and effort required to launch a campaign.
In-depth Campaign Analysis
In-depth Campaign Analysis
Equip users with tools for thorough post-campaign analysis.
Highlight lessons learned and areas for improvement in future campaigns.
Present data in a way that facilitates understanding and drives actionable insights
Equip users with tools for thorough post-campaign analysis.
Highlight lessons learned and areas for improvement in future campaigns.
Present data in a way that facilitates understanding and drives actionable insights
Priority of the features
Priority of the features
Based on our interviews and analysis, the essential features required for the ad management platform were identified and prioritized. These priorities will guide the design and development process to ensure that the most critical functionalities are prominently featured and easily accessible.
Based on our interviews and analysis, the essential features required for the ad management platform were identified and prioritized. These priorities will guide the design and development process to ensure that the most critical functionalities are prominently featured and easily accessible.


Main features and structure
Main features and structure
Information Architecture
Information Architecture
Based on the insights derived up to this point, I developed the information architecture for our ad management platform. The structure prioritizes the dashboard as the central hub, where users can easily monitor and manage campaigns, access performance metrics, and customize their experience.
Based on the insights derived up to this point, I developed the information architecture for our ad management platform. The structure prioritizes the dashboard as the central hub, where users can easily monitor and manage campaigns, access performance metrics, and customize their experience.


Information Architecture based on analysis
Information Architecture based on analysis
User Flow
User Flow
The user flow presented here illustrates the key stages of interaction with the Ads Management Tool, encompassing, campaign creation, and campaign management. This high-level flow focuses on critical milestones and decision points to ensure a seamless user experience.
The user flow presented here illustrates the key stages of interaction with the Ads Management Tool, encompassing, campaign creation, and campaign management. This high-level flow focuses on critical milestones and decision points to ensure a seamless user experience.
View Dashboard
Display error message
Highlight missing fields
Successful login?
Are all mandatory fields filled?
Login
Campaigns’ list
View campaign info
Analyze performance
Export, Edit, or Delete
Create campaign
Create campaign
Create campaign
Open active campaign
Fill general info
Define parameters
Review & Submit
Review & Submit
Point of Entry
Create Campaign
Manage Campaigns
Yes
Alternatively, user can create campaign right from the dashboard
No
No
Access campaigns list, view insights
View existing campaigns, open active campaign
Yes
Design Solution
Design Solution
Color Palette
Color Palette


Design System Contribution
Design System Contribution
Identified gaps, and developed new components to ensure consistency and scalability across the platform.
Identified gaps, and developed new components to ensure consistency and scalability across the platform.
Component Audit
Component Audit
Evaluated the existing design system to identify inconsistencies and gaps affecting scalability.
Evaluated the existing design system to identify inconsistencies and gaps affecting scalability.
New Components Created
Components Created
Designed and developed atom, molecule, and organism-level components to improve modularity and maintain consistency across the platform.
Designed and developed atom, molecule, and organism-level components to improve modularity and maintain consistency across the platform.
Stakeholder Alignment
Stakeholder Alignment
Collaborated closely with cross-functional teams to align design decisions with project objectives and technical requirements, ensuring seamless integration.
Collaborated closely with cross-functional teams to align design decisions with project objectives and technical requirements, ensuring seamless integration.


Overview Dashboard
Overview Dashboard
1st Iteration
1st Iteration
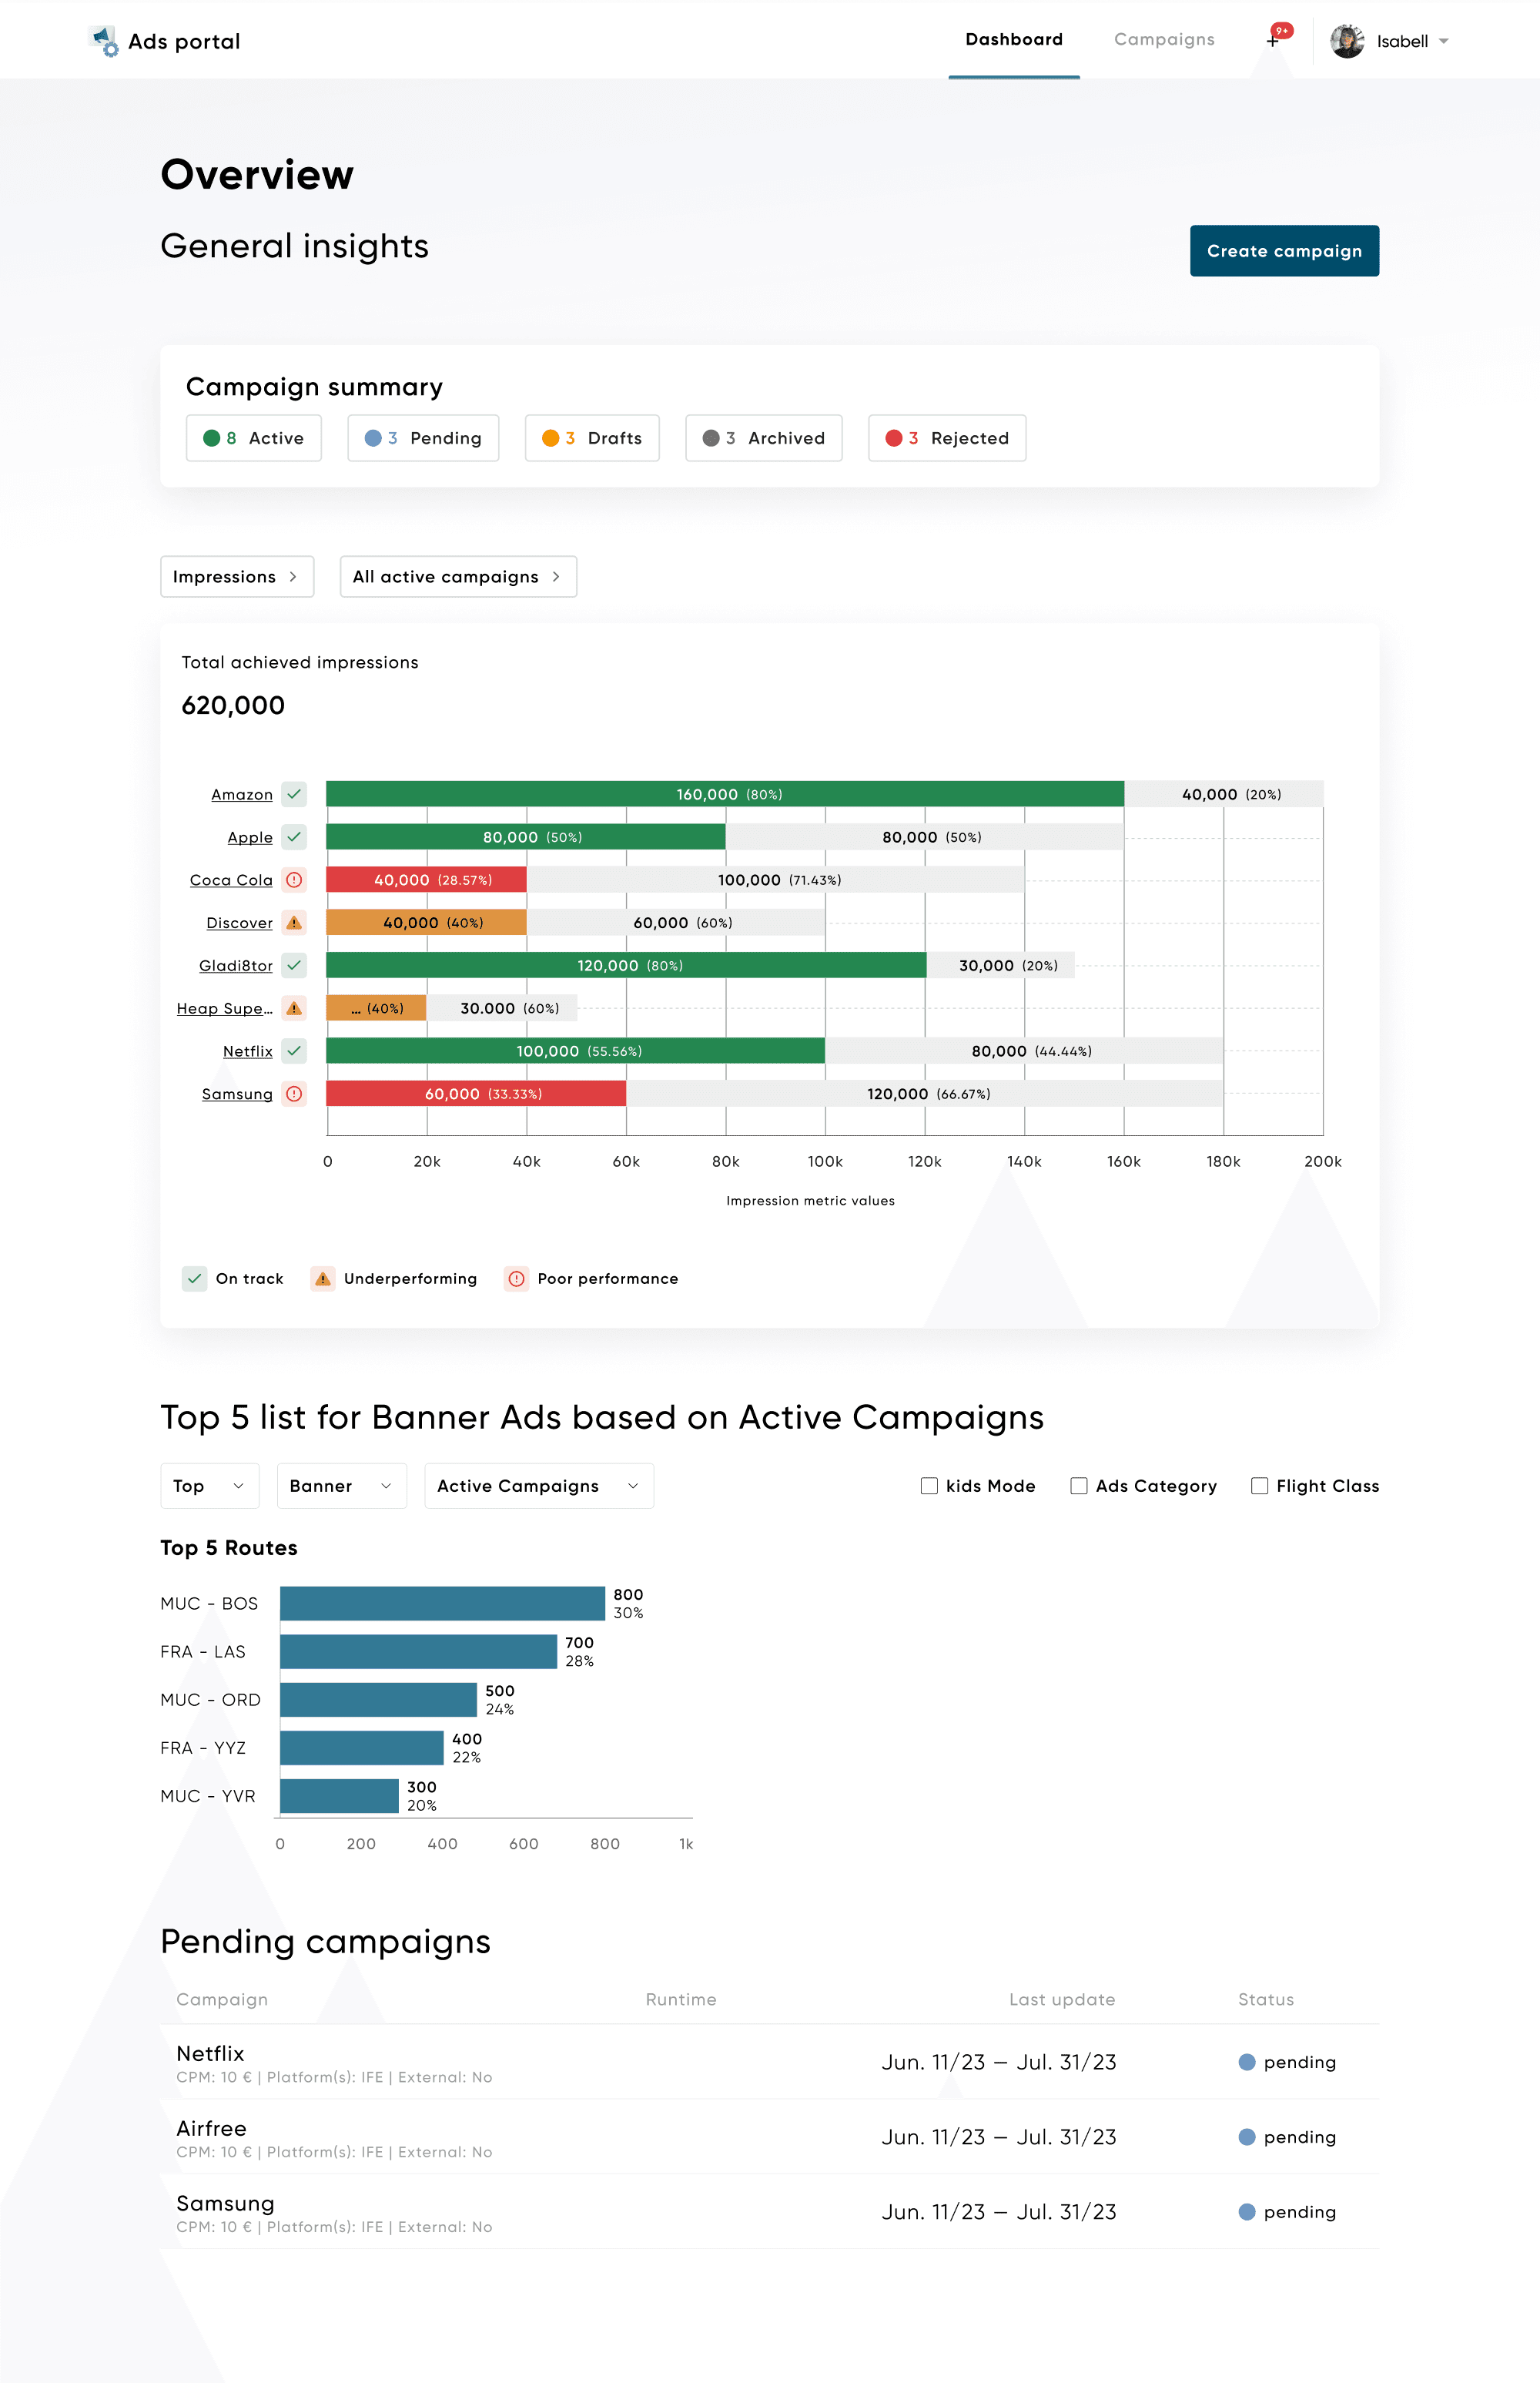
Addresses key research insights by simplifying the user interface for improved navigation. The color-coded metrics (e.g., campaign performance) provide real-time feedback, fulfilling the need for immediate insights. The filtering options and top 5 list enable customization and tailored ad analysis.
Addresses key research insights by simplifying the user interface for improved navigation. The color-coded metrics (e.g., campaign performance) provide real-time feedback, fulfilling the need for immediate insights. The filtering options and top 5 list enable customization and tailored ad analysis.

Problems
Problems
Cluttered Interface
Cluttered Interface
The layout is overwhelming, making it hard to find key metrics quickly.
The layout is overwhelming, making it hard to find key metrics quickly.
Color Confusion
Color Confusion
The colors in the campaign summary and graphs are hard to distinguish.
The colors in the campaign summary and graphs are hard to distinguish.
Lack of Detailed Insights
Lack of Detailed Insights
Users need more granular data, like impression trends for different ad types.
Users need more granular data, like impression trends for different ad types.
Summary Preference
Summary Preference
Users prefer a total summary of flight legs and passengers instead of a campaign summary.
Users prefer a total summary of flight legs and passengers instead of a campaign summary.
2nd Iteration
2nd Iteration
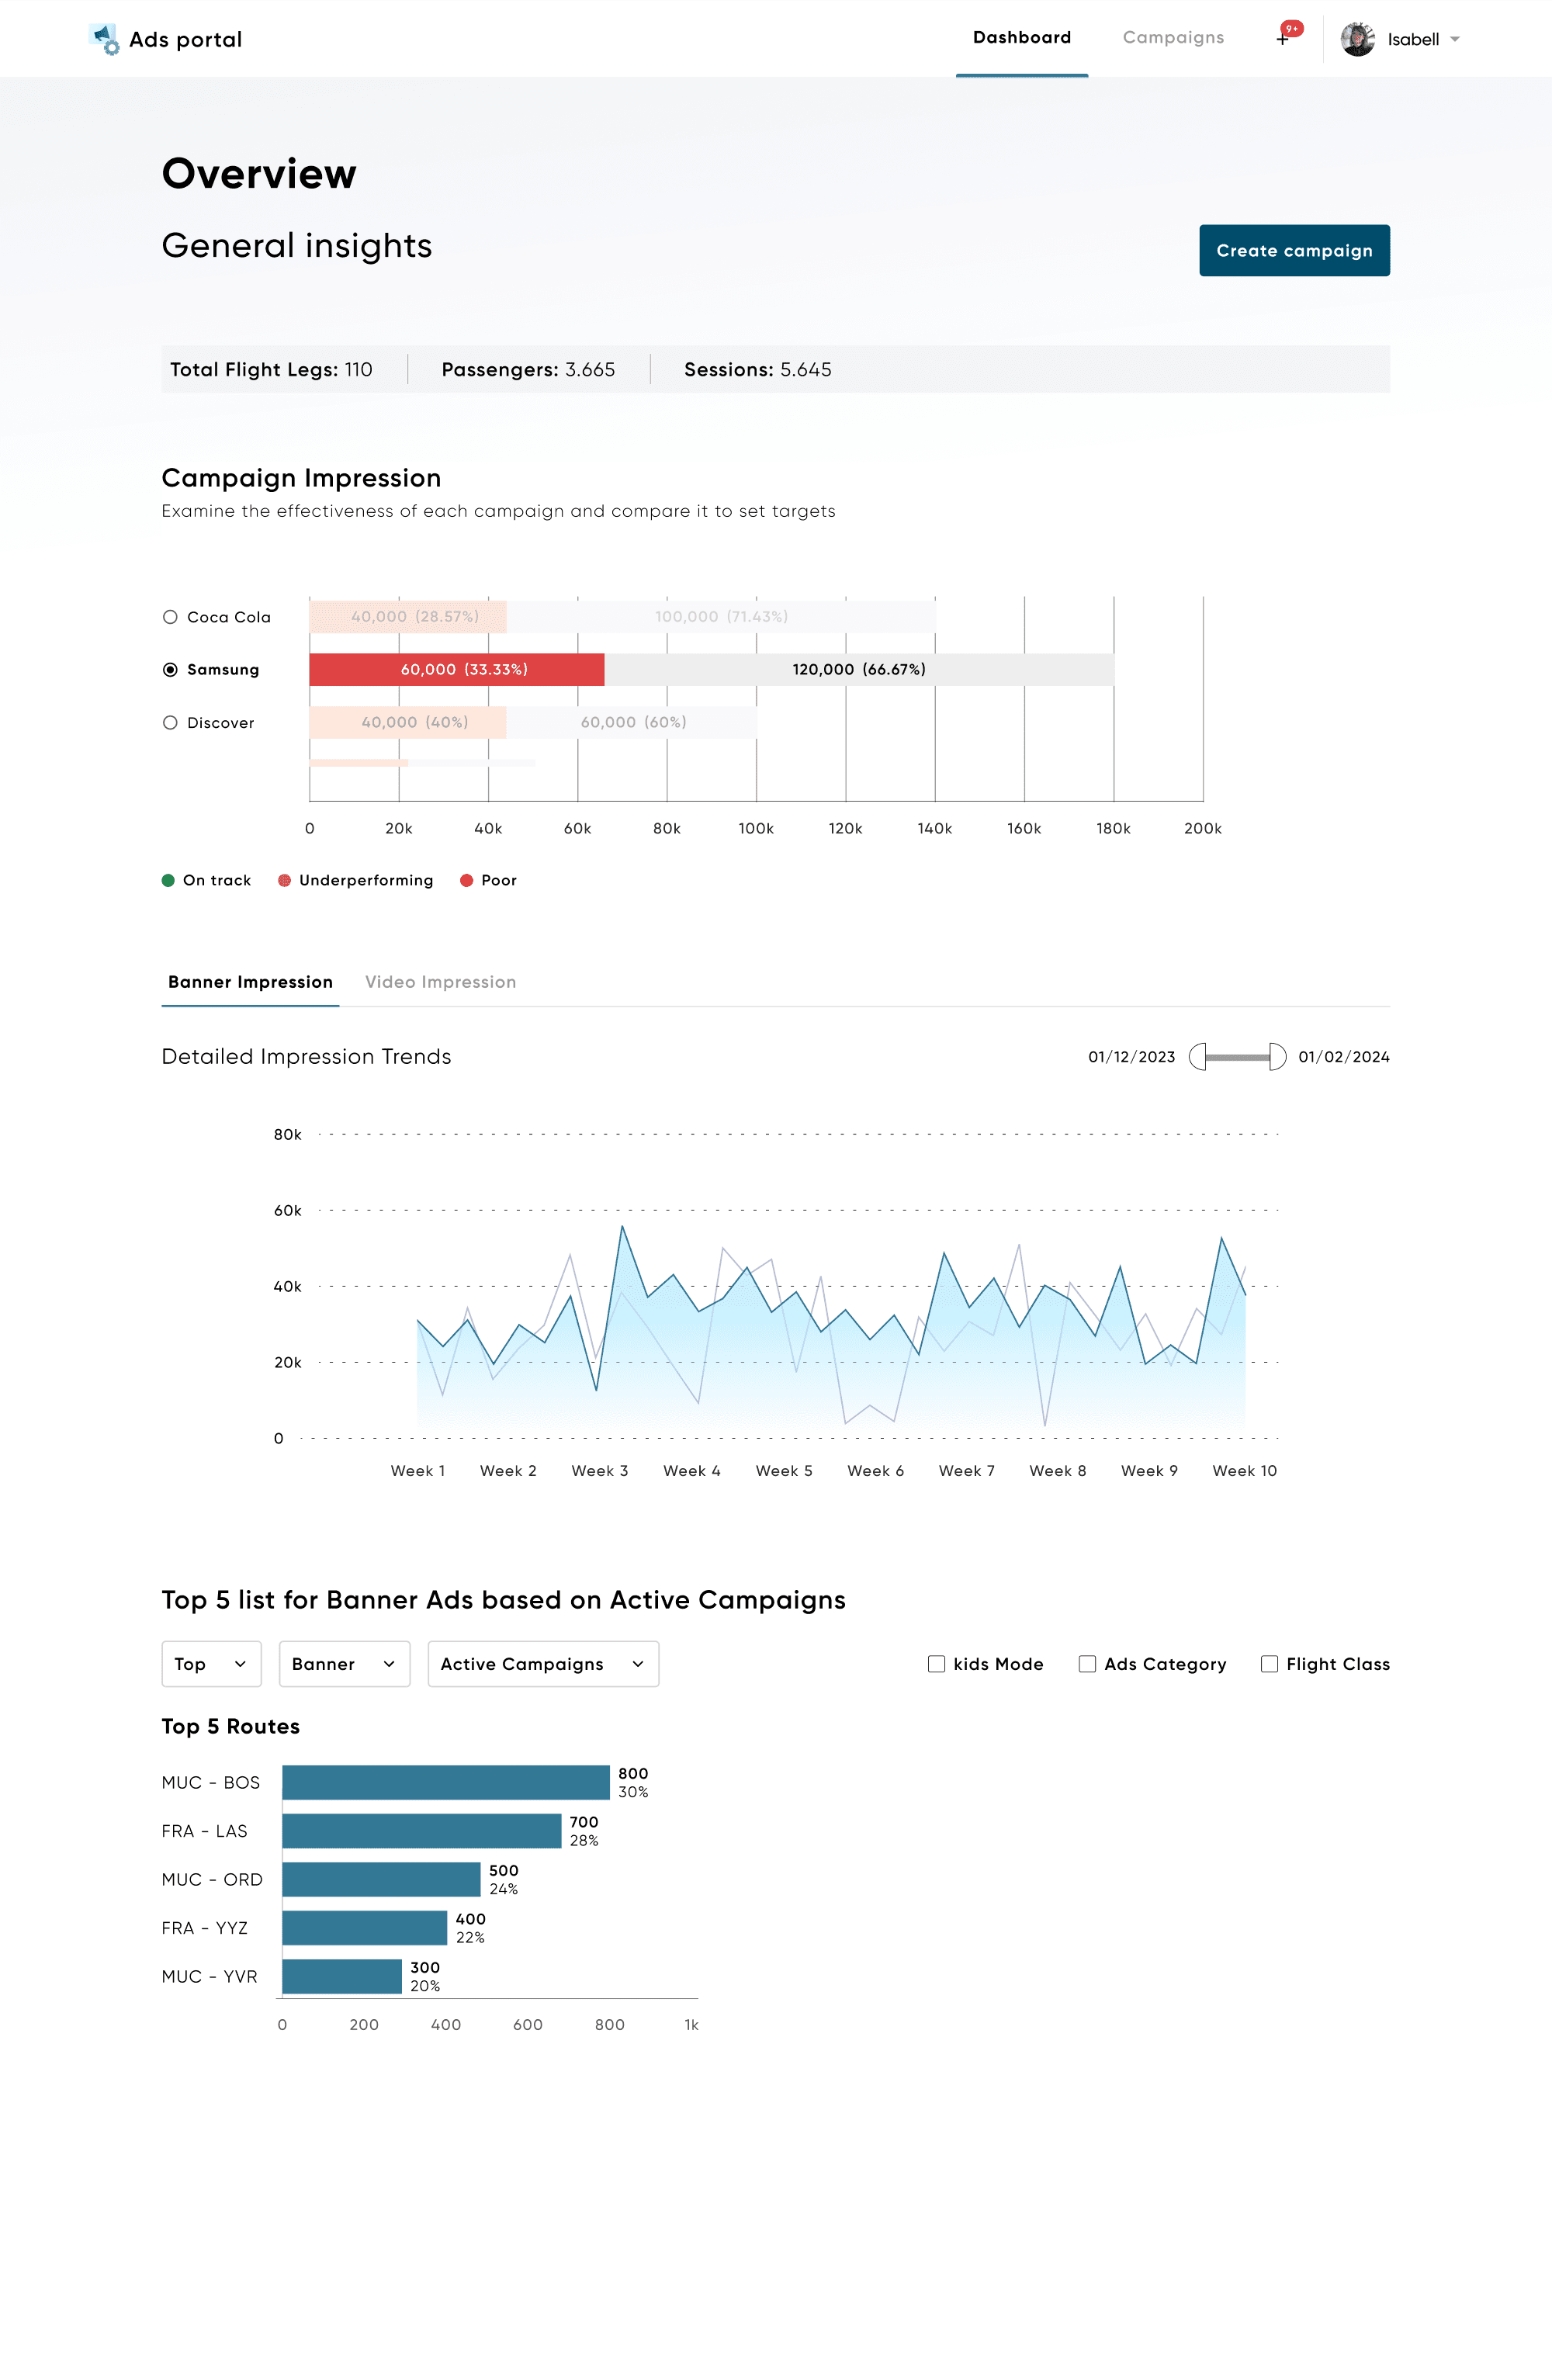
Embodies a couple of key usability and accessibility refinements, ensuring that the platform not only meets users' functional needs but also provides an inclusive and intuitive user experience.
Embodies a couple of key usability and accessibility refinements, ensuring that the platform not only meets users' functional needs but also provides an inclusive and intuitive user experience.

Improvements
Improvements
Streamlined Layout
Streamlined Layout
Prioritized key metrics to reduce clutter and improve focus.
Prioritized key metrics to reduce clutter and improve focus.
Removed Ambiguities
Removed Ambiguities
Eliminated any confusing elements to avoid misinterpretation.
Eliminated any confusing elements to avoid misinterpretation.
Detailed Ad Insights
Detailed Ad Insights
Added an area chart to display trends for Banner and Video ads.
Added an area chart to display trends for Banner and Video ads.
Summary Replacement
Summary Replacement
Replaced the confusing campaign summary with total flight legs, passengers, and sessions.
Replaced the confusing campaign summary with total flight legs, passengers, and sessions.
Create a campaign
Create a campaign
Campaign Overview
Campaign Overview
The campaign creation process allows users to easily initiate, target, and manage ad campaigns by inputting key details, setting global targeting, defining ad frequency, selecting watch tags, and uploading media assets.
The campaign creation process allows users to easily initiate, target, and manage ad campaigns by inputting key details, setting global targeting, defining ad frequency, selecting watch tags, and uploading media assets.


Campaign details
Campaign details
Campaign info
Campaign info
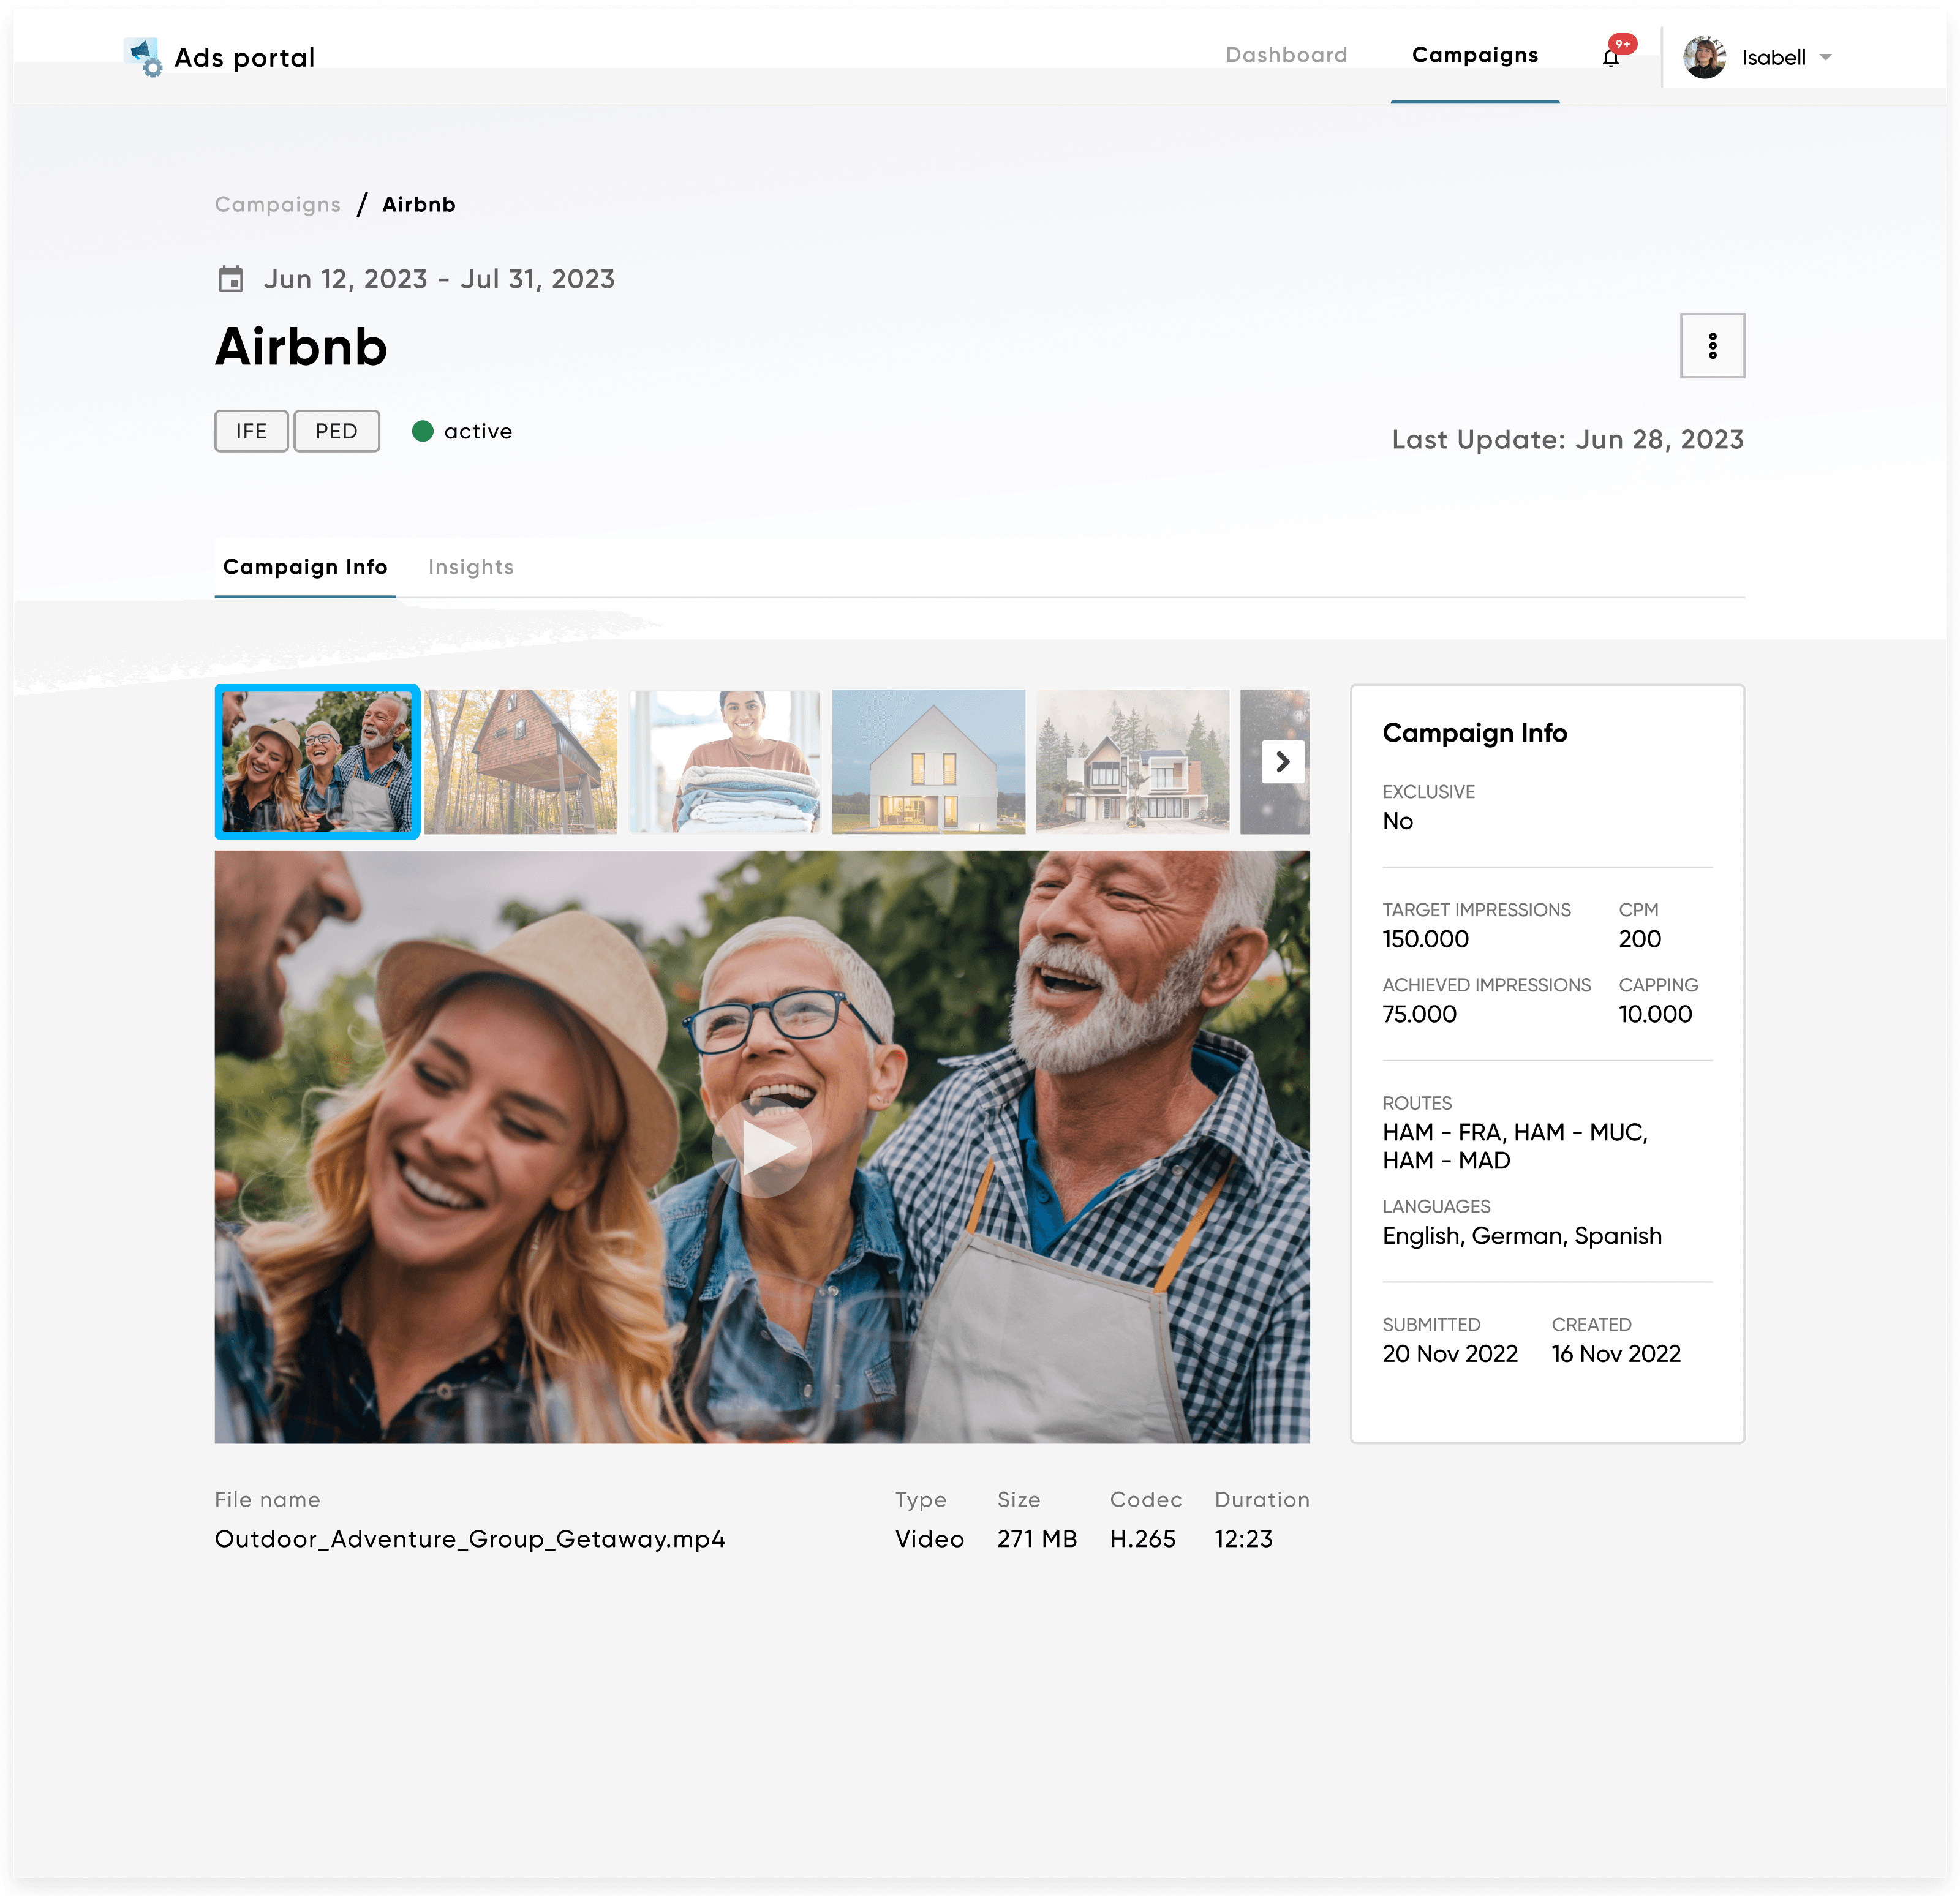
Includes target and achieved impressions, CPM, capping, and flight routes across multiple cities. Media assets are showcased in a carousel, as well as a clean sidebar presenting all vital campaign metrics, ensuring quick access to essential data for tracking performance and optimizations.
Includes target and achieved impressions, CPM, capping, and flight routes across multiple cities. Media assets are showcased in a carousel, as well as a clean sidebar presenting all vital campaign metrics, ensuring quick access to essential data for tracking performance and optimizations.

Insights (1st iteration)
Insights (1st iteration)
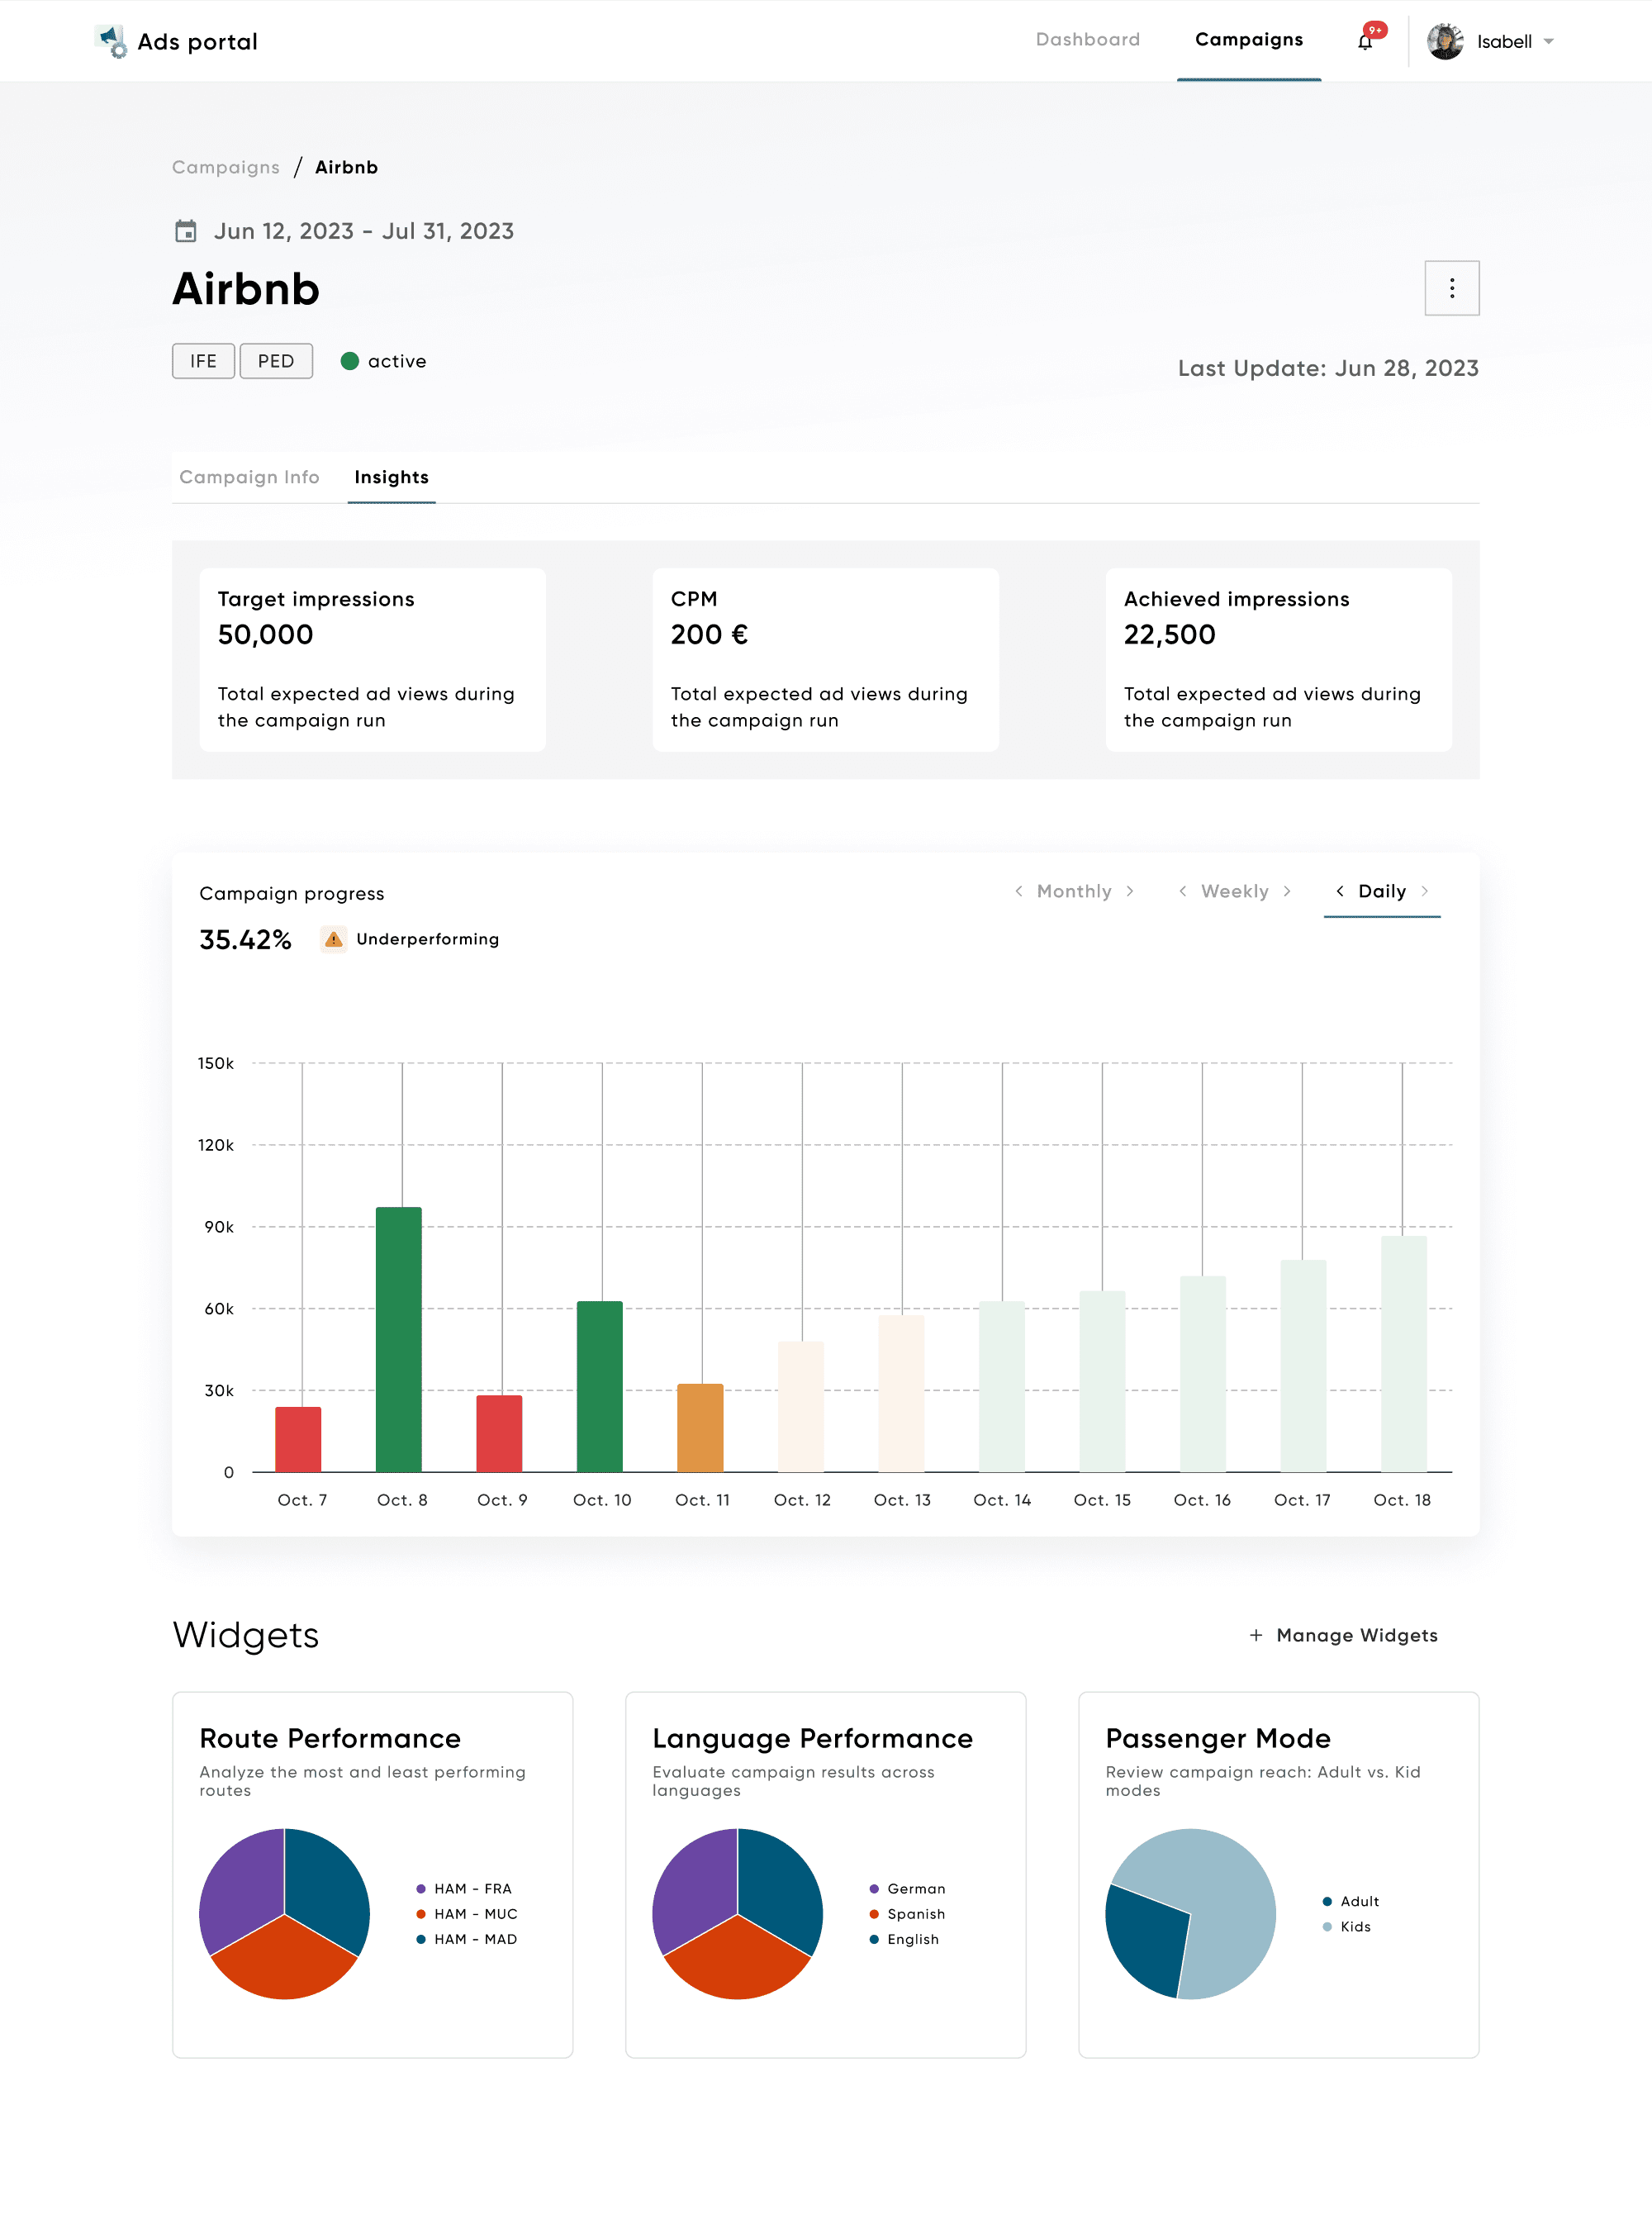
Focused on a clear presentation of key metrics such as target impressions, CPM (Cost Per Mile), and achieved impressions. As well as, introducing widgets to allow users to delve into specific performance aspects like route performance, language performance, and passenger mode.
Focused on a clear presentation of key metrics such as target impressions, CPM (Cost Per Mile), and achieved impressions. As well as, introducing widgets to allow users to delve into specific performance aspects like route performance, language performance, and passenger mode.

Problems
Problems
Unclear Visuals
Unclear Visuals
The progress visualization and color coding were not intuitive.
The progress visualization and color coding were not intuitive.
Readability Issues
Readability Issues
The hierarchical layout made it difficult to prioritize key metrics at a glance.
The hierarchical layout made it difficult to prioritize key metrics at a glance.
Limited Widgets
Limited Widgets
Widgets lacked depth in data and didn't offer customization options.
Widgets lacked depth in data and didn't offer customization options.
Rigid Design
Rigid Design
The design limited user interaction and customization based on specific needs.
The design limited user interaction and customization based on specific needs.
Insights (2nd Iteration)
Insights (2nd Iteration)
A significant step forward in making the campaign performance feature more intuitive, informative, and user-centric, based on gathered feedback.
A significant step forward in making the campaign performance feature more intuitive, informative, and user-centric, based on gathered feedback.
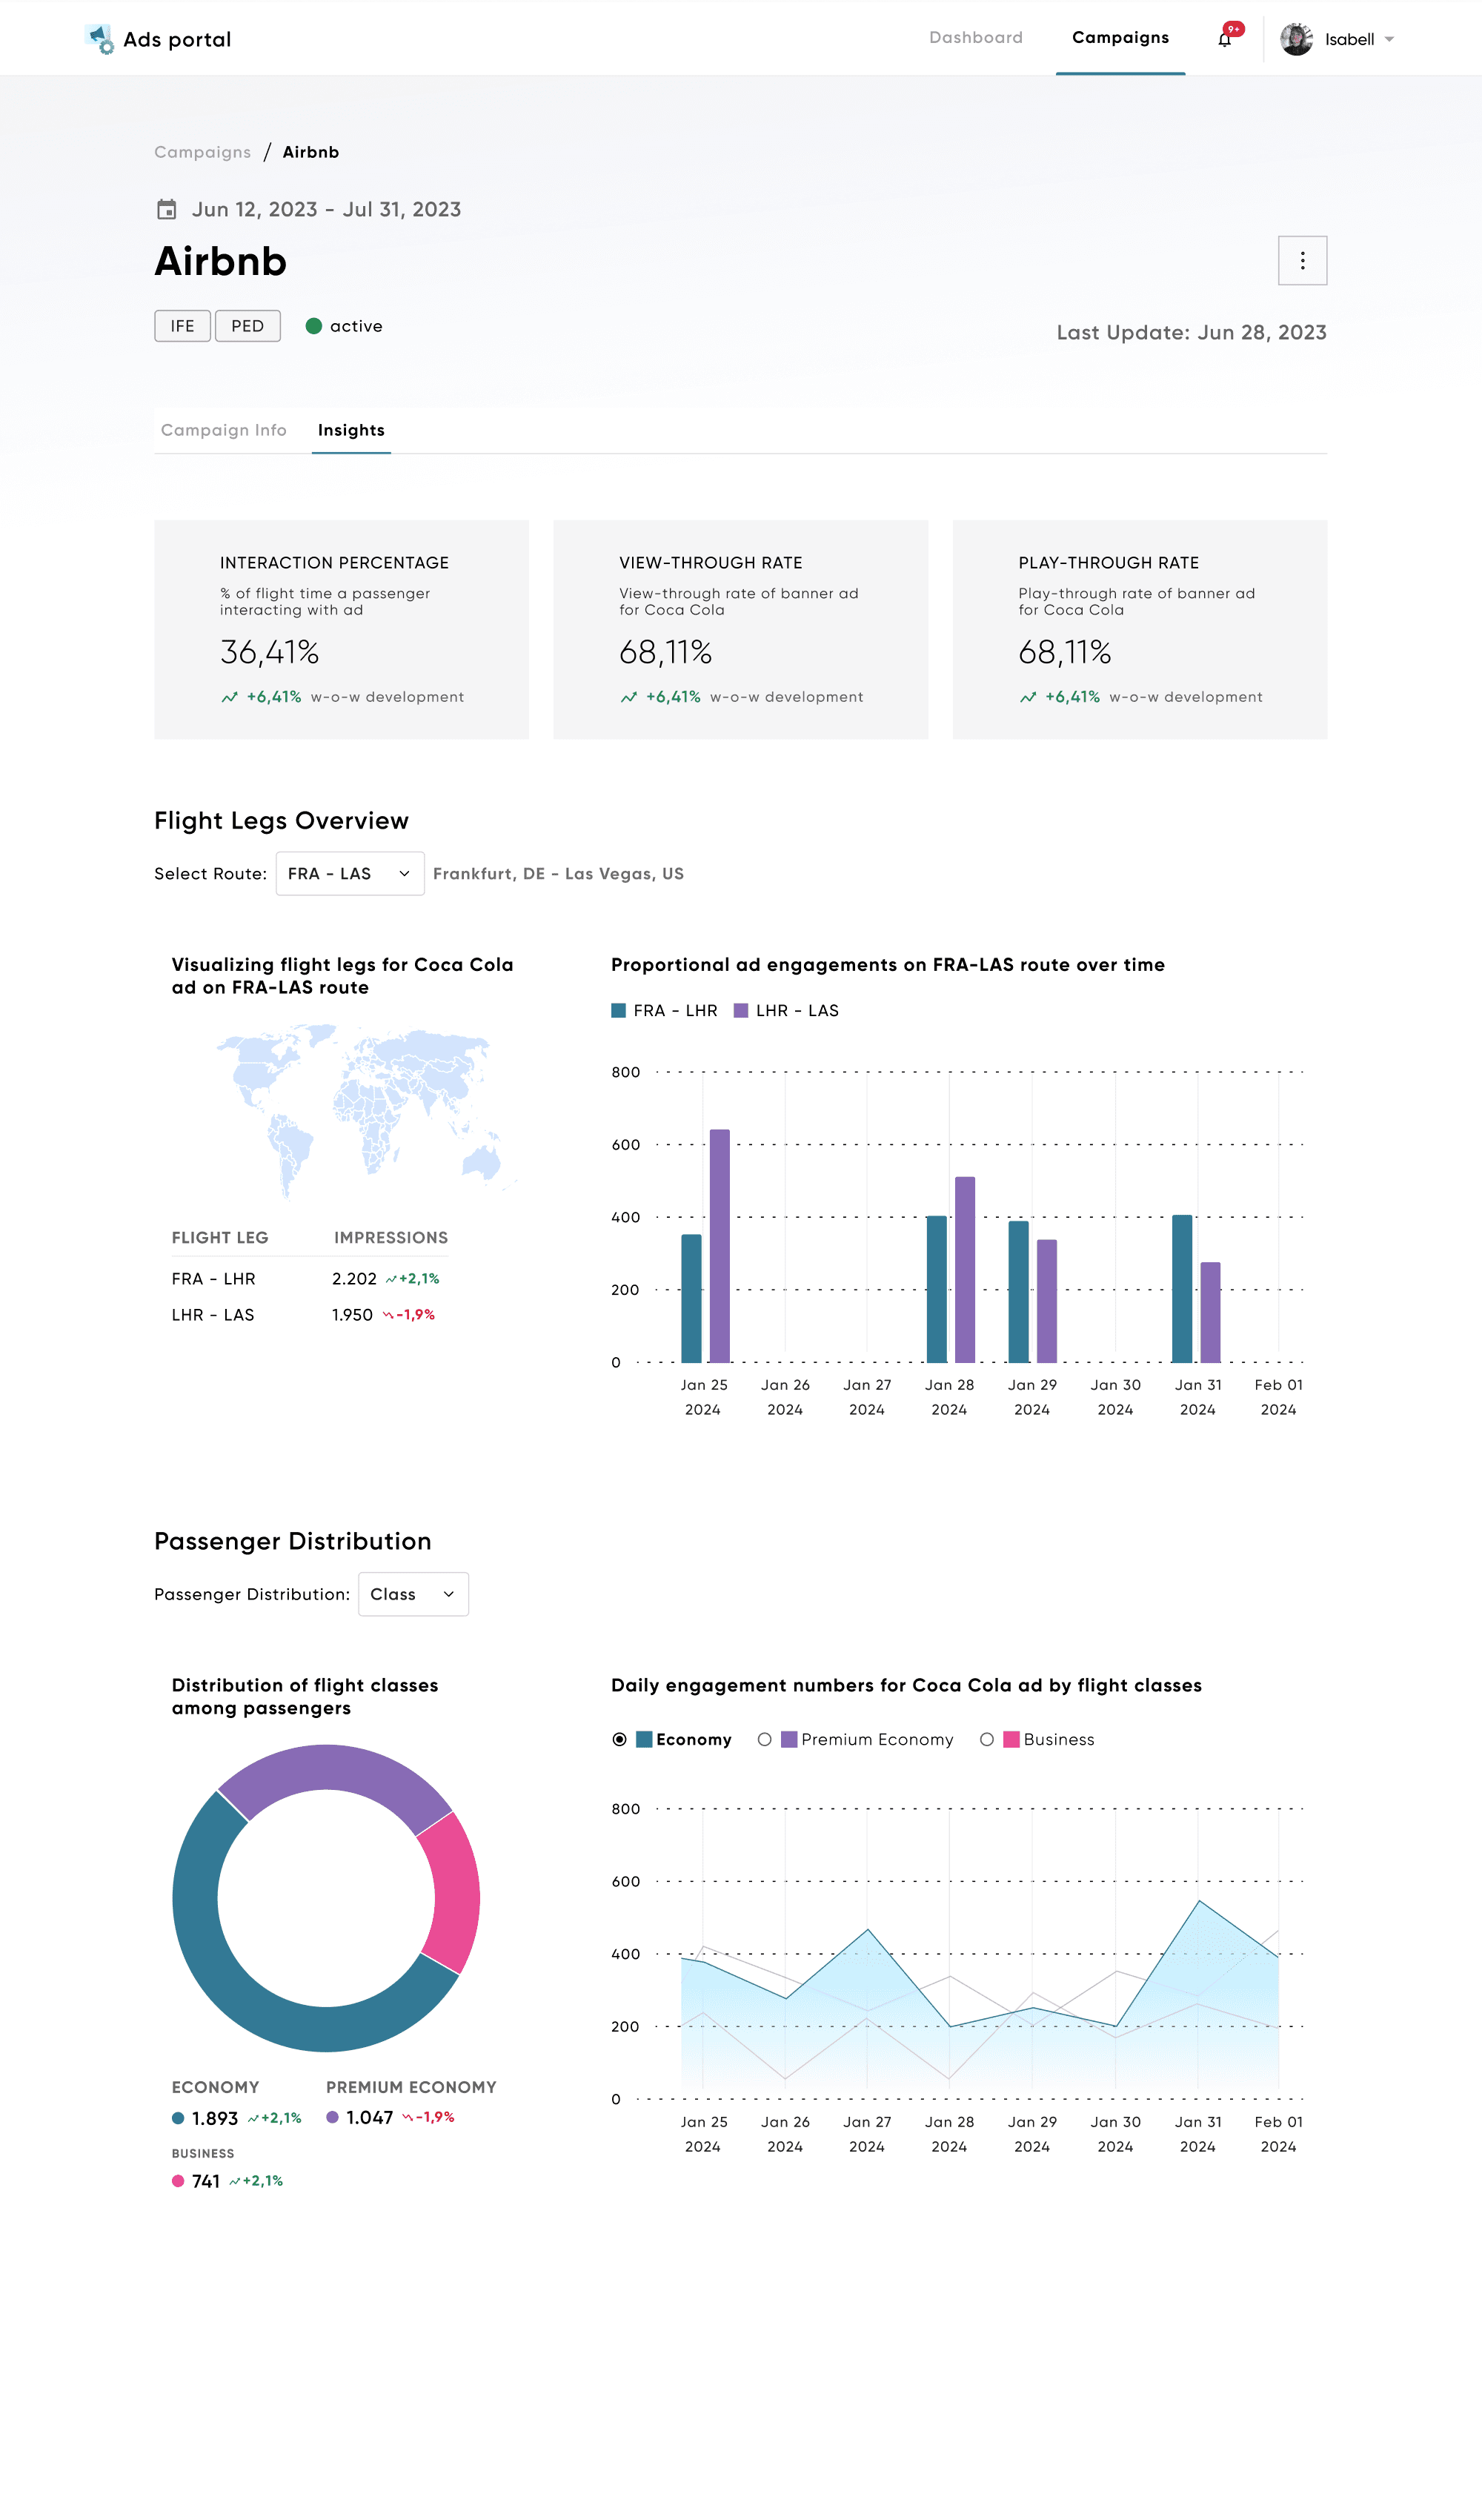

Improvements
Improvements
Refined Key Metrics
Refined Key Metrics
Key metrics were refined and highlighted for easy assessment of performance trends.
Key metrics were refined and highlighted for easy assessment of performance trends.
Expanded Flight and Passenger Data
Expanded Flight and Passenger Data
Flight Legs Overview and Passenger Distribution sections now offer detailed breakdowns for a holistic view of campaign performance.
Flight Legs Overview and Passenger Distribution sections now offer detailed breakdowns for a holistic view of campaign performance.
Comparative Graphs
Comparative Graphs
New graphs track engagement trends over time, helping users make informed decisions.
New graphs track engagement trends over time, helping users make informed decisions.
Flexible Data Views
Flexible Data Views
Users can toggle between different views (e.g., passenger type, language) for tailored data analysis.
Users can toggle between different views (e.g., passenger type, language) for tailored data analysis.
Wrap up
Wrap up
Measuring success
Measuring success
Improved user efficiency by 50%
Improved user efficiency by 50%
Future iterations will focus on incorporating advanced customization options and real-time data integration to further enhance the platform's functionality and user satisfaction.
Future iterations will focus on incorporating advanced customization options and real-time data integration to further enhance the platform's functionality and user satisfaction.
Constraints & Compromises
Constraints & Compromises
Designing the Ads Management Platform for airlines came with its own set of challenges and necessary trade-offs. Given the technical constraints and the scope of our MVP, we made the following decisions:
Designing the Ads Management Platform for airlines came with its own set of challenges and necessary trade-offs. Given the technical constraints and the scope of our MVP, we made the following decisions:
We initially excluded advanced customization options for dashboards to ensure a streamlined and user-friendly experience.
Advanced data integration features were postponed to avoid potential complexities and ensure smooth initial functionality.
Certain interactive features, such as real-time collaboration tools, were set aside to focus on core functionalities.
Some in-depth performance metrics were simplified to maintain system performance and user comprehension.
Challenges faced and how I dealt with them
Challenges faced and how I dealt with them
This was to be done within 2 months which demanded efficient operations and swift decision making to stay on track
This was to be done within 2 months which demanded efficient operations and swift decision making to stay on track
Employed a highly organized and strategic approach, breaking down tasks into manageable sprints, prioritizing critical features, and maintaining close communication with stakeholders to ensure timely decisions.
Employed a highly organized and strategic approach, breaking down tasks into manageable sprints, prioritizing critical features, and maintaining close communication with stakeholders to ensure timely decisions.
As the sole UX designer, balancing multiple tasks from research to final design documentation was challenging, requiring meticulous time management
As the sole UX designer, balancing multiple tasks from research to final design documentation was challenging, requiring meticulous time management
Leveraged cross-functional collaboration by actively aligning with developers and product owner. Utilized peer reviews and design critiques to broaden perspectives and enhance the design quality.
Leveraged cross-functional collaboration by actively aligning with developers and product owner. Utilized peer reviews and design critiques to broaden perspectives and enhance the design quality.
Consolidating vast amounts of data from various sources into actionable design strategies was complex but crucial, for success
Consolidating vast amounts of data from various sources into actionable design strategies was complex but crucial, for success
Implemented structured methodologies for data analysis, using tools like affinity diagrams and user journey maps. Regularly validated insights through iterative testing and feedback loops, ensuring data-driven decision making throughout the design process.
Implemented structured methodologies for data analysis, using tools like affinity diagrams and user journey maps. Regularly validated insights through iterative testing and feedback loops, ensuring data-driven decision making throughout the design process.


Challenge
Maximizing airlines' ancillary revenue through seamless ad campaign management, while enhancing passenger engagement with minimal friction. Our goal is to create an experience that integrates transactional and engagement aspects of in-flight advertising, ensuring high-value ad placements and optimal passenger interaction.
Results
To address this challenge, we developed a comprehensive ad management platform that empowers airlines to seamlessly manage and optimize their ad campaigns. The solution includes features for detailed targeting, media uploads, and in-depth analytics across multiple platforms – iOS, Android, and Web. Airlines can create tailored campaigns, upload various media types, and analyze performance with minimal friction.
Duration
3 months (2024)
My Role
UX Designer
Contribution
Problem definition; POC flows; user testing and synthesis; high-fidelity prototypes; MVP documentation and QA
Team
Product Owner; Snr Software Engineers
Company
Lufthansa (AERQ)
Introduction
To comply with non-disclosure agreement, I have omitted and obfuscated confidential information in this case study. All information in this case study is my own and does not necessarily reflect the views & facts of the company.
Problem Definition
How might we design an intuitive and data-driven platform that enhances the ad management process for airlines, leading to more effective and impactful inflight ad campaigns?
Analysis
Stakeholder interviews
5 participants
Benchmarking
3 competitors
Key Assumptions
Streamlined Dashboard
IFE managers need a simple dashboard for efficient campaign management.
Targeted Ad Tools
Advertisers require better targeting tools for increased engagement.
Real-Time Analytics
The product must provide real-time insights to adjust strategies swiftly.
Problems
Lack of Targeting Precision
Ad management tools struggle with targeting accuracy, leading to inconsistent performance and lower ROI for airlines.
Fragmented Tool Ecosystem
The current tools are fragmented, causing inefficiencies in managing ad campaigns across multiple platforms.
Weak Analytics Capabilities
Insufficient analytics features prevent actionable insights, hindering real-time, data-driven decision-making.
How might we create a unified and intuitive ad management platform that enhances ad targeting, streamlines campaign management, and delivers real-time insights tailored to the needs of IFE managers and advertising partners in the airline industry?
Who are our users?
Based on 1:1 interviews with 6 professionals from different airlines, we identified two key user groups for our ad management platform: Inflight Entertainment (IFE) Managers and Advertising Partners. These groups have distinct goals and challenges, seeking a platform that integrates intuitive navigation with data-driven insights to better meet their respective needs.
User research findings
1:1 Interviews
6 participants
Through in-depth interviews, 2 primary user personas emerged:


Personas developed based on 6 interviews
Understand Users’ Intentions
Research outcome
Real-Time Feedback
Users need instant access to campaign metrics for quick adjustments.
Customization
Users prefer flexibility in dashboard designs and metrics selection.
Detailed Metrics
In-depth performance analysis is crucial for better decision-making.
Simplified Campaign Creation
Reducing the time and effort to launch campaigns is vital.
Comprehensive Analysis
Users seek detailed reports for future strategies.
I categorized the users’ feedback, their expectations and intentions into 5 categories: real-time performance feedback, customizable dashboards, detailed performance metrics, streamlined campaign creation, and in-depth campaign analysis. To better understand users’ intentions I utilized the rainbow sheet analysis method.


Rainbow sheet created by me
Design Goals
We established the primary design goals based on the insights gathered from stakeholder interviews, workshops, and the analysis of user needs. The overarching objective is to design an intuitive, data-driven, and user-friendly ad management platform tailored for the airline industry.
Real-time Performance Feedback
Enable instant access to campaign performance metrics.
Provide actionable insights that allow for immediate optimization of campaigns.
Design intuitive interfaces that present real-time data clearly and concisely.
Customizable Dashboards
Offer flexible dashboard layouts that can be tailored to individual needs.
Allow users to choose which metrics and data points are most relevant to them.
Include quick access features for frequently used tools and reports.
Detailed Performance Metrics
Provide comprehensive analytics to measure ad performance across multiple dimensions.
Include features that allow for the deep dive into specific data points.
Ensure metrics are presented in a way that supports strategic decision-making.
Streamlined Campaign Creation
Simplify the process of creating and managing ad campaigns with templates and guided workflows.
Integrate tools that assist in setting up, running, and monitoring campaigns efficiently.
Ensure the platform reduces the time and effort required to launch a campaign.
In-depth Campaign Analysis
Equip users with tools for thorough post-campaign analysis.
Highlight lessons learned and areas for improvement in future campaigns.
Present data in a way that facilitates understanding and drives actionable insights
Priority of the features
Based on our interviews and analysis, the essential features required for the ad management platform were identified and prioritized. These priorities will guide the design and development process to ensure that the most critical functionalities are prominently featured and easily accessible.


Main features and structure
Information Architecture
Based on the insights derived up to this point, I developed the information architecture for our ad management platform. The structure prioritizes the dashboard as the central hub, where users can easily monitor and manage campaigns, access performance metrics, and customize their experience.


Information Architecture based on analysis
User Flow
The user flow presented here illustrates the key stages of interaction with the Ads Management Tool, encompassing, campaign creation, and campaign management. This high-level flow focuses on critical milestones and decision points to ensure a seamless user experience.


Design Solution
Color Palette


Design System Contribution
Identified gaps, and developed new components to ensure consistency and scalability across the platform.
Component Audit
Evaluated the existing design system to identify inconsistencies and gaps affecting scalability.
Components Created
Designed and developed atom, molecule, and organism-level components to improve modularity and maintain consistency across the platform.
Stakeholder Alignment
Collaborated closely with cross-functional teams to align design decisions with project objectives and technical requirements, ensuring seamless integration.


Overview Dashboard
1st Iteration
Addresses key research insights by simplifying the user interface for improved navigation. The color-coded metrics (e.g., campaign performance) provide real-time feedback, fulfilling the need for immediate insights. The filtering options and top 5 list enable customization and tailored ad analysis.


Problems
Cluttered Interface
The layout is overwhelming, making it hard to find key metrics quickly.
Color Confusion
The colors in the campaign summary and graphs are hard to distinguish.
Lack of Detailed Insights
Users need more granular data, like impression trends for different ad types.
Summary Preference
Users prefer a total summary of flight legs and passengers instead of a campaign summary.
2nd Iteration
Embodies a couple of key usability and accessibility refinements, ensuring that the platform not only meets users' functional needs but also provides an inclusive and intuitive user experience.


Improvements
Streamlined Layout
Prioritized key metrics to reduce clutter and improve focus.
Removed Ambiguities
Eliminated any confusing elements to avoid misinterpretation.
Detailed Ad Insights
Added an area chart to display trends for Banner and Video ads.
Summary Replacement
Replaced the confusing campaign summary with total flight legs, passengers, and sessions.
Create a campaign
Campaign Overview
The campaign creation process allows users to easily initiate, target, and manage ad campaigns by inputting key details, setting global targeting, defining ad frequency, selecting watch tags, and uploading media assets.
Campaign details
Campaign info
Includes target and achieved impressions, CPM, capping, and flight routes across multiple cities. Media assets are showcased in a carousel, as well as a clean sidebar presenting all vital campaign metrics, ensuring quick access to essential data for tracking performance and optimizations.


Insights (1st iteration)
Focused on a clear presentation of key metrics such as target impressions, CPM (Cost Per Mile), and achieved impressions. As well as, introducing widgets to allow users to delve into specific performance aspects like route performance, language performance, and passenger mode.


Problems
Unclear Visuals
The progress visualization and color coding were not intuitive.
Readability Issues
The hierarchical layout made it difficult to prioritize key metrics at a glance.
Limited Widgets
Widgets lacked depth in data and didn't offer customization options.
Rigid Design
The design limited user interaction and customization based on specific needs.
Insights (2nd Iteration)
A significant step forward in making the campaign performance feature more intuitive, informative, and user-centric, based on gathered feedback.


Improvements
Refined Key Metrics
Key metrics were refined and highlighted for easy assessment of performance trends.
Expanded Flight and Passenger Data
Flight Legs Overview and Passenger Distribution sections now offer detailed breakdowns for a holistic view of campaign performance.
Comparative Graphs
New graphs track engagement trends over time, helping users make informed decisions.
Flexible Data Views
Users can toggle between different views (e.g., passenger type, language) for tailored data analysis.
Wrap up
Current state
The project has been fully implemented, addressing the needs of IFE managers and airline advertising partners. Moving forward, future iterations will rely on real-world usage data and feedback from these stakeholders. This will help refine features and optimize performance, ensuring the platform continues to meet evolving demands in the airline advertising space.
Measuring success
Achieved a 20% reduction in task completion time as measured by unmoderated user testing with Useberry.
Initial feedback from user testing indicated significant improvements in usability and efficiency. Future iterations will focus on incorporating advanced customization options and real-time data integration to further enhance the platform's functionality and user satisfaction.
Constraints & Compromises
Designing the Ads Management Platform for airlines came with its own set of challenges and necessary trade-offs. Given the technical constraints and the scope of our MVP, we made the following decisions:
We initially excluded advanced customization options for dashboards to ensure a streamlined and user-friendly experience.
Advanced data integration features were postponed to avoid potential complexities and ensure smooth initial functionality.
Certain interactive features, such as real-time collaboration tools, were set aside to focus on core functionalities.
Some in-depth performance metrics were simplified to maintain system performance and user comprehension.
Challenges faced and how I dealt with them
This was to be done within 2 months which demanded efficient operations and swift decision making to stay on track
Employed a highly organized and strategic approach, breaking down tasks into manageable sprints, prioritizing critical features, and maintaining close communication with stakeholders to ensure timely decisions.
As the sole UX designer, balancing multiple tasks from research to final design documentation was challenging, requiring meticulous time management
Leveraged cross-functional collaboration by actively aligning with developers and product owner. Utilized peer reviews and design critiques to broaden perspectives and enhance the design quality.
Consolidating vast amounts of data from various sources into actionable design strategies was complex but crucial, for success
Implemented structured methodologies for data analysis, using tools like affinity diagrams and user journey maps. Regularly validated insights through iterative testing and feedback loops, ensuring data-driven decision making throughout the design process.


charlesjaja.dny@gmail.com
charlesjaja.dny@gmail.com
2025 Charles Jaja
2025 Charles Jaja
Say hello